Bar chart
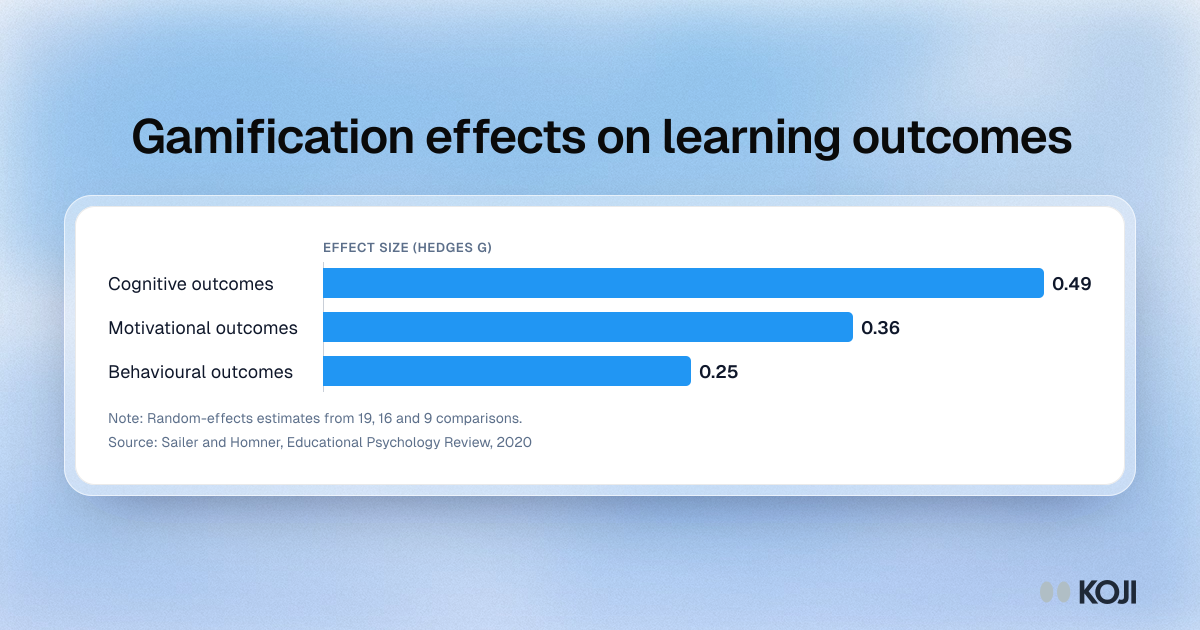
Gamification effects on learning outcomes
Pooled effect sizes for gamified vs non-gamified instruction, by type of outcome
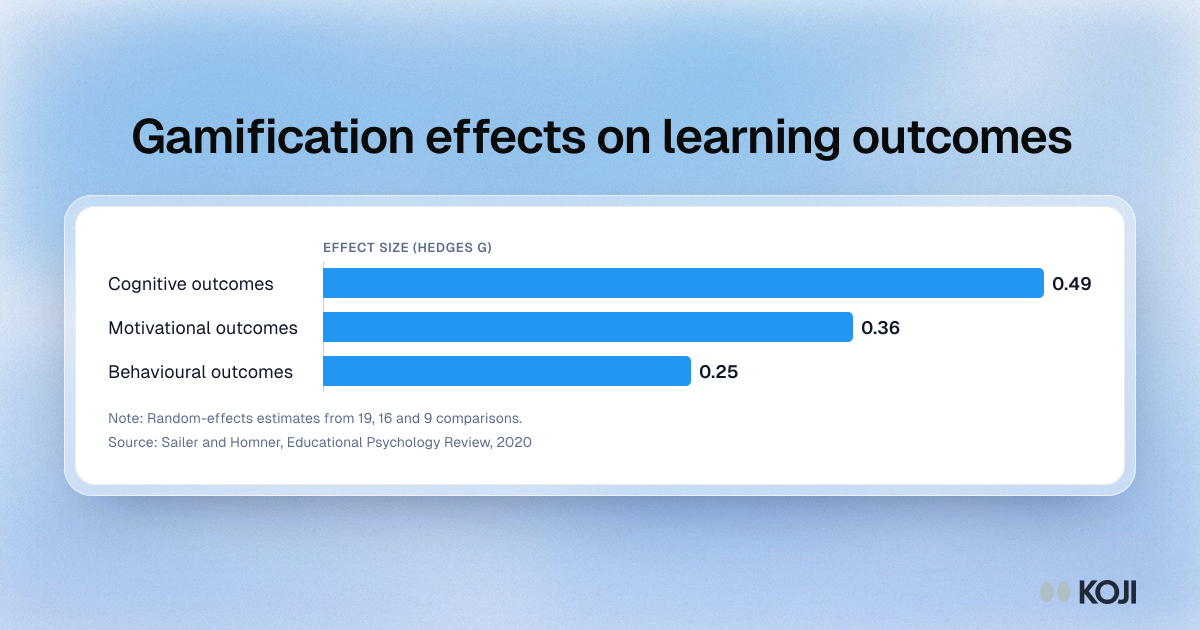
A bar chart of the pooled effects of gamification on three kinds of learning outcome, from the Sailer and Homner meta-analysis. Test performance showed the largest and most stable effect, while effects on motivation and behaviour were smaller and less robust in high-rigour studies. Quality officers and programme directors can use it when judging a gamified course: ask students about their experience, but check learning with assessment data. Koji can run short interviews that ask students separately how game elements felt and whether they changed how they studied.
What's in this bar chart
| Hedges g | |
|---|---|
| Cognitive outcomes | 0.49 |
| Motivational outcomes | 0.36 |
| Behavioural outcomes | 0.25 |
Random-effects estimates from 19, 16 and 9 comparisons.
Use this image
Free to use in your docs, decks and posts under CC BY 4.0, as long as you credit Koji with a link to this page. To embed it, paste this into your page:
<a href="https://www.koji.so/visuals/gamification-effects-learning-outcomes-meta-analysis"><img src="https://www.koji.so/visuals/gamification-effects-learning-outcomes-meta-analysis/gamification-effects-learning-outcomes-meta-analysis.png" alt="Bar chart of gamification effects on learning outcomes: cognitive g 0.49, motivational g 0.36, behavioural g 0.25." width="1200" height="630" /></a>
<p>Source: <a href="https://www.koji.so/visuals/gamification-effects-learning-outcomes-meta-analysis">Gamification effects on learning outcomes</a>, Koji</p>