Bar chart
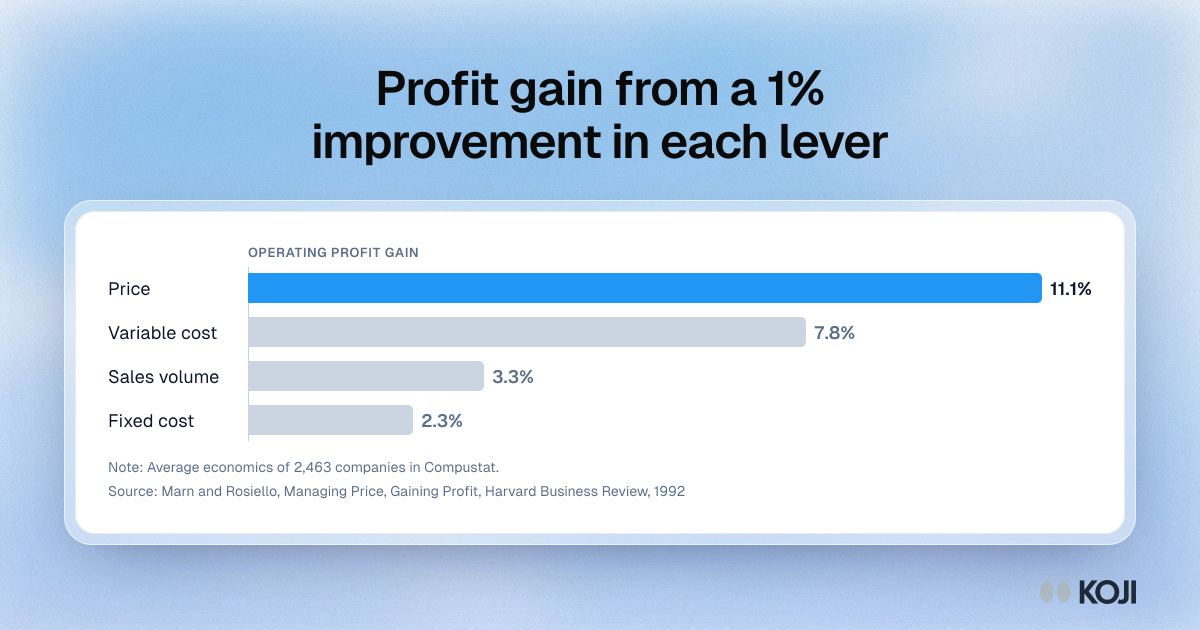
Profit gain from a 1% improvement in each lever
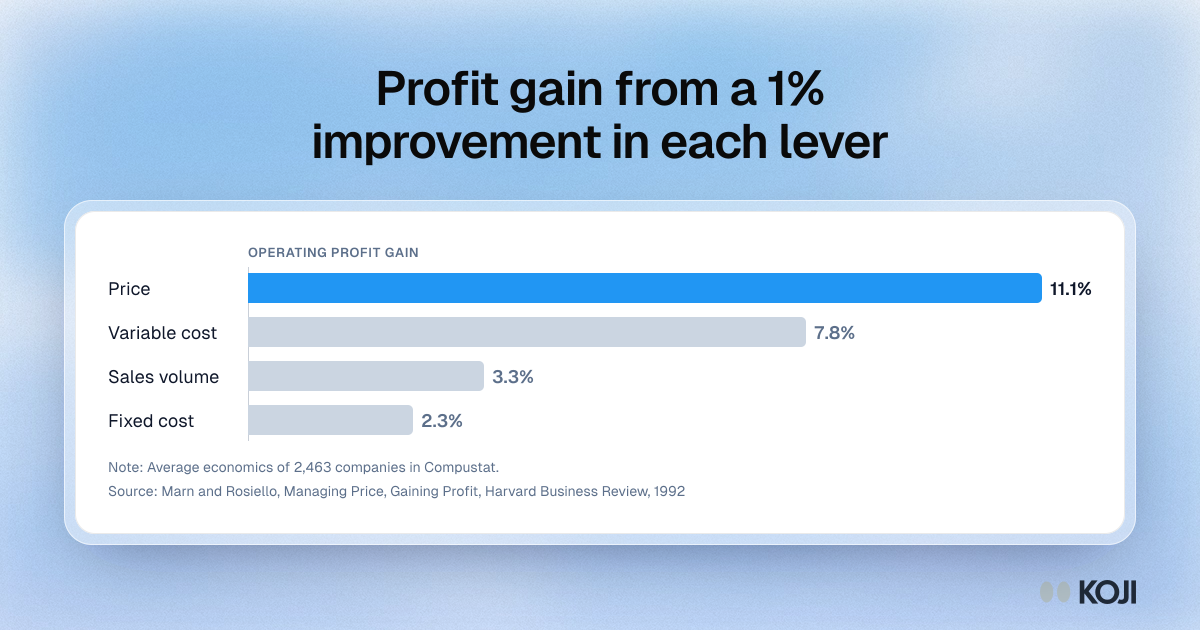
A bar chart of how much operating profit rises when a company improves price, variable cost, sales volume or fixed cost by 1%, from Marn and Rosiello's analysis of 2,463 companies. Price moves profit the most, at 11.1%. Use it to show a team why a pricing study deserves careful reading. Koji's price test helps put it into practice by showing demand, revenue and the reasons at each price.
Where this appears
What's in this bar chart
| Operating profit gain | |
|---|---|
| Price | 11.1% |
| Variable cost | 7.8% |
| Sales volume | 3.3% |
| Fixed cost | 2.3% |
Average economics of 2,463 companies in Compustat.
Use this image
Free to use in your docs, decks and posts under CC BY 4.0, as long as you credit Koji with a link to this page. To embed it, paste this into your page:
html
<a href="https://www.koji.so/visuals/one-percent-price-improvement-profit-levers"><img src="https://www.koji.so/visuals/one-percent-price-improvement-profit-levers/one-percent-price-improvement-profit-levers.png" alt="Bar chart of operating profit gain from a 1% improvement in each lever: price 11.1%, variable cost 7.8%, volume 3.3%, fixed cost 2.3%." width="1200" height="630" /></a>
<p>Source: <a href="https://www.koji.so/visuals/one-percent-price-improvement-profit-levers">Profit gain from a 1% improvement in each lever</a>, Koji</p>