How to Read a Price Test: Demand, Revenue and the Reasons
How to read a Gabor-Granger price test result in four passes: sample size, both ends of the ladder, near ties in revenue, and the reasons behind each drop in demand.
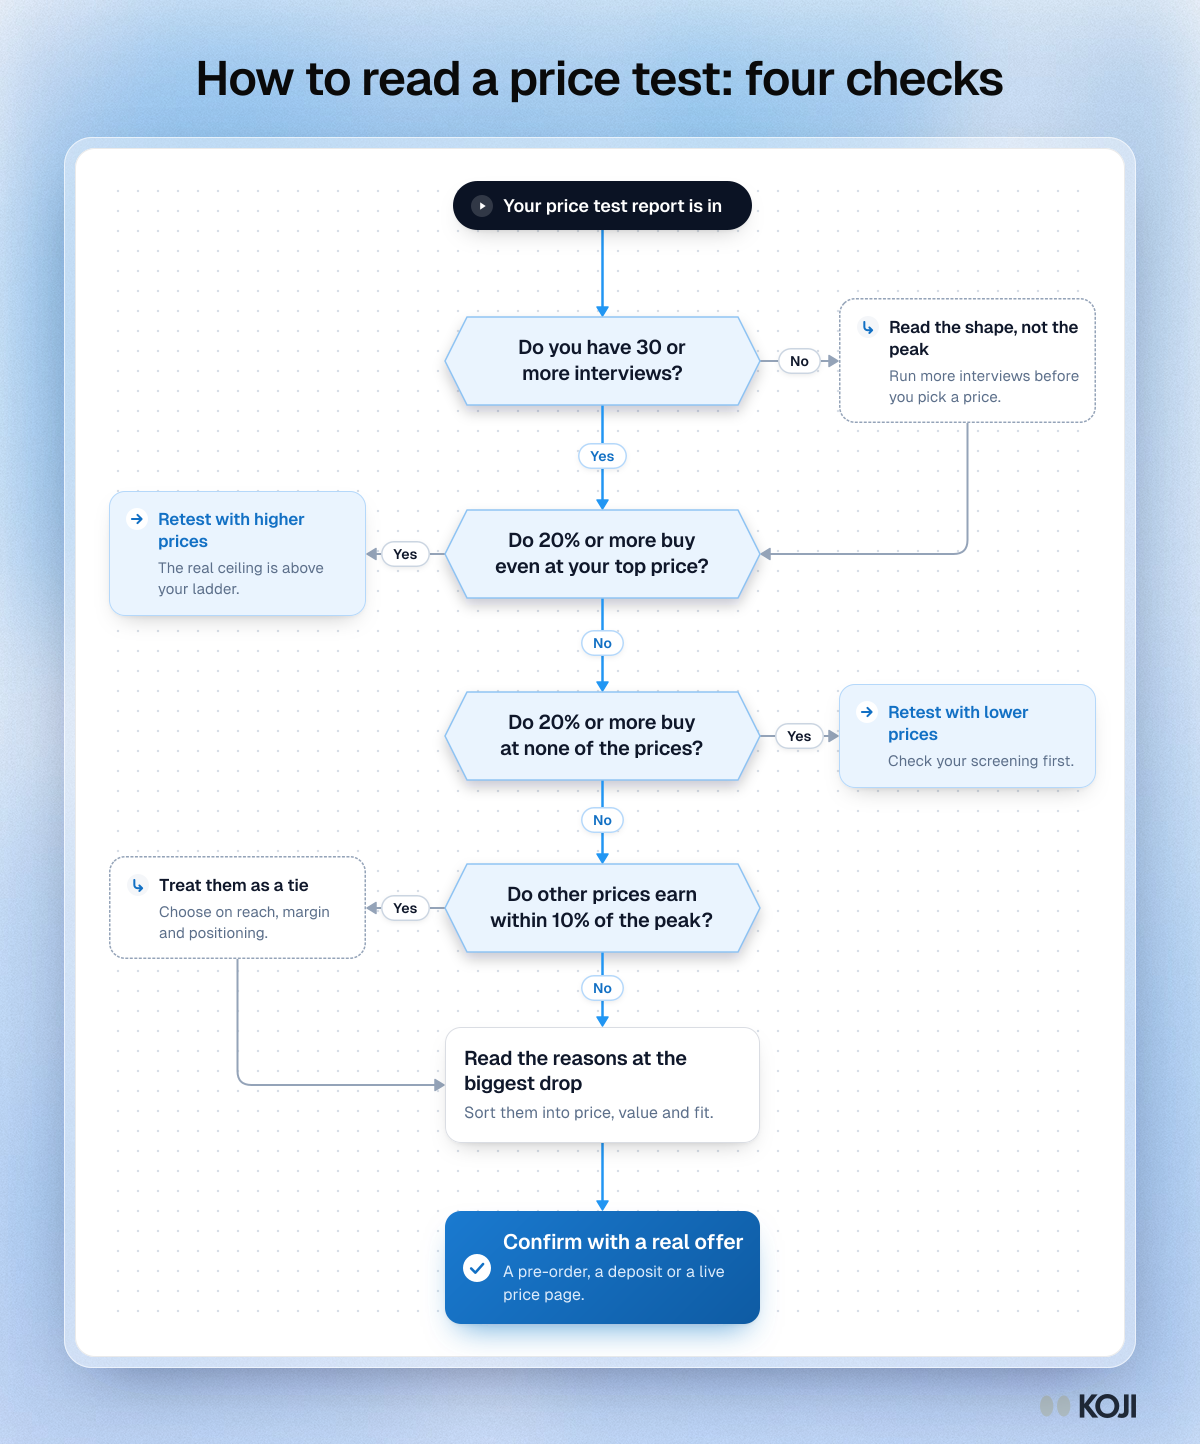
Short answer: read a Gabor-Granger price test in four passes. First check the sample: under about 30 interviews, read the shape of the curve, not its peak. Then check both ends of the ladder: if a fifth or more of people would buy even at your top price, or at none of your prices, the range was wrong and you should retest. Then look for a near tie: any price that earns within about 10% of the peak is a real contender, not a loser. Last, read why people stopped where they did, because the reasons tell you whether to change the price, the offer or the audience.
Try it this week: open a finished price test report, write down the peak price and every price within 10% of it, then click the price row just above the peak and read what the people who stopped there said. That one step answers most of what the curve can't. The rest of this guide explains each pass with a worked example.
What a price test gives you
A Gabor-Granger test shows each person one price at a time and asks how likely they are to buy at it. It moves up when they would buy and down when they would not, until it finds the highest price that person would still pay. The method is named after André Gabor and Clive Granger, whose work on price and buying behaviour appeared in Economica in 1966. For the full method, see the Gabor-Granger method guide.
Every person ends up with one number: the most they would pay, from the prices you tested. Add everyone up and you get three things.
- The demand curve: the share of people who would buy at each price. It can only go down as the price goes up, because anyone who would pay €49 would also pay €39.
- The revenue curve: each price multiplied by the share who would buy at it. This is revenue per person asked, not total revenue, so it compares prices fairly whatever your market size.
- The peak: the tested price where that revenue is highest.
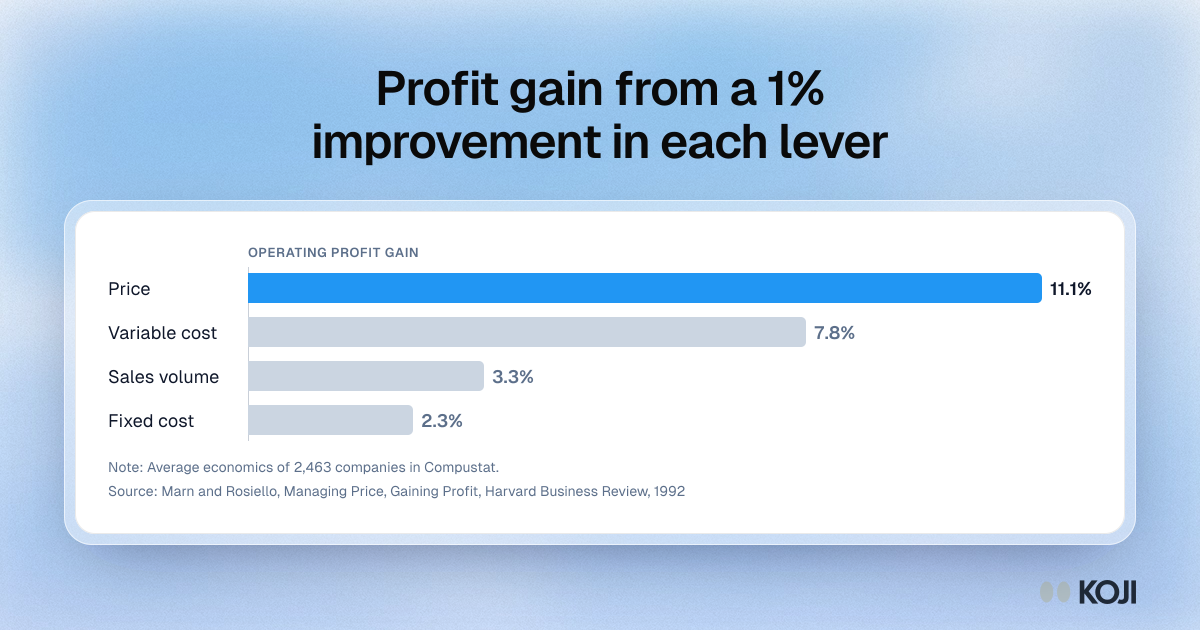
Getting this reading right is worth the time. In Marn and Rosiello's analysis of 2,463 companies (Harvard Business Review, 1992), a 1% improvement in price lifted operating profit by 11.1%. The same improvement in variable cost gave 7.8%, in sales volume 3.3% and in fixed cost 2.3%. McKinsey's later analysis of S&P 1500 companies put the price effect above 8%. Price is the lever with the most weight, so a misread curve costs more than most research mistakes.
A worked example
The numbers below are illustrative, made up to show how a reading works. They are not from a real study.
A team tests a subscription at five prices with 30 people who fit the buyer profile: €19, €29, €39, €49 and €59 per month. Three people would buy at none of the prices. The rest stop at different points.
| Price per month | Would buy | Share | Earns per person asked | Stopped here |
|---|---|---|---|---|
| €19 | 27 of 30 | 90% | €17.10 | 4 |
| €29 | 23 of 30 | 77% | €22.23 | 6 |
| €39 | 17 of 30 | 57% | €22.10 | 8 |
| €49 | 9 of 30 | 30% | €14.70 | 5 |
| €59 | 4 of 30 | 13% | €7.87 | 4 |
| None | 3 |
"Stopped here" counts the people for whom that was the highest price they would pay. The four at €59 would pay at least €59, and maybe more.
A quick read says "€29 wins." A careful read says something different, and the four passes below show why.
Pass 1: Is the sample big enough to pick a price?
With 30 interviews, each person moves a share by about 3 points. That is enough to see the shape of demand: where it holds, where it falls and how steeply. It is not enough to tell two prices with close revenue apart.
Rules of thumb:
- Under 30 interviews: treat the result as an early signal. Read where demand falls, and run more interviews before you commit to a price.
- About 30: enough to see the shape and hear the reasons. Pick a range, not a single point.
- 100 or more per segment: the classic level for a precise point on the curve, if a single number really matters (a public price list, a large launch).
If you have two segments, such as small teams and larger companies, read them separately. A blended curve can peak at a price that suits neither.
Pass 2: Did your ladder bracket the real range?
The best price a test can find is always one of the prices you tested. If the real best price sits above or below your ladder, the test can't see it. Check both ends.
- The top end: if 20% or more of people would buy even at your highest price, your ladder probably stops too low. The real ceiling is unknown. Retest with higher prices added.
- The bottom end: if 20% or more would buy at none of your prices, either the ladder starts too high or you asked people who aren't buyers. Check your screening first, then add lower prices.
In the example, 4 of 30 (13%) would buy at €59 and 3 of 30 (10%) at none. Both are under the 20% line, so the ladder bracketed the market well enough. A few people at the top is normal: some buyers always value the product far above the rest.
If you need to redesign the ladder, Choosing the prices to test covers how many prices to use and how far apart to space them.
Pass 3: Is the peak really a peak?
Revenue curves are often flat near the top. In the example, €29 earns €22.23 per person asked and €39 earns €22.10. That is a difference of under 1%, which one person changing their mind would reverse.
Use a simple rule: any price that earns within 10% of the peak is a tie at this sample size. Here, €29 and €39 are tied. €19 earns 23% less but sells to 90%, and €49 earns 34% less.
A tie is useful, not a problem. It means you can choose between those prices on other grounds:
- Reach: €29 sells to 77%, €39 to 57%. If you need adoption, word of mouth or a large base to upsell later, the cheaper price costs you almost nothing.
- Margin and support cost: if each customer costs real money to serve, fewer customers at €39 can earn more profit for the same revenue.
- Positioning: a price signals who the product is for. A higher price can fit a premium position the reasons support.
- Room to grow: it is usually easier to add a higher tier later than to raise a price people already pay.
Write the tie into your recommendation. "€29 to €39 earn about the same. We recommend €39 because..." is a stronger decision than "€29 is optimal", and it is what the data supports.
Pass 4: Read the reasons behind each drop
The curve tells you where people stop. It doesn't tell you why, and the why decides what you do next. Read the answers from the people who stopped at each price, starting with the biggest drop. In the example, demand falls hardest between €39 and €49 (from 57% to 30%), so read the 8 people who stopped at €39 first.

Photo by Brooke Cagle on Unsplash
Sort what you hear into three kinds of reason:
- Price: "That's more than I pay for [alternative]." "Over €40 I'd need sign-off." These point to a real ceiling, often tied to a budget line or a competitor.
- Value: "At that price I'd expect integrations." "I'd only pay that if it saved me a day a week." These point to packaging. The price may hold if the offer changes.
- Fit: "We're two people, we'd never use it enough." These point to the audience. The person may not be your buyer at any price.
A drop full of price reasons is a ceiling to respect. A drop full of value reasons is an opportunity: a richer plan at a higher price, or a cheaper plan with less in it. A drop full of fit reasons is a screening problem, and the curve above it may be overstated.
Also read the people who would buy at none of the prices. They tell you whether the problem is the price or the product.
Madhavan Ramanujam, co-author of Monetizing Innovation, put the stakes plainly on Lenny's Podcast in 2022: "You cannot prioritize a product roadmap without having a willingness to pay conversation." The reasons behind the curve are that conversation, at scale. They also help with a wider problem: the book reports Simon-Kucher's finding that 72% of innovations fail to meet their financial targets or fail entirely, and it traces many of those failures to pricing left until the end.
What a price test can't tell you
Be honest about the limits when you share the result.
- Stated intent runs high. People say they would buy more often than they do. There is no cost to saying "probably" in an interview. Treat the curve as directional, and read shares as an upper bound.
- It prices one offer in isolation. People answer without competitors' prices in front of them. If substitutes matter, add a question about what they use and pay today, or use conjoint analysis.
- It finds the revenue peak, not the profit peak. Factor in your cost to serve.
- It can't see between your prices. If €29 and €39 tie, €34 might be better. You'd only know by testing it.
Then confirm with something people do, not say: a pre-order, a deposit, a letter of intent, or a live price page shown to real visitors. The interview narrows the range and explains it. Behaviour settles it.
How to share the result
A good pricing recommendation fits on one slide:
- The range: "€29 to €39 per month earn about the same with our target buyers (30 interviews)."
- The recommendation and why: "€39, because the people who stopped there named missing integrations, not budget."
- The limit: "Stated intent, so read shares as an upper bound."
- The next test: "A live price page at €39 for four weeks."
If you are a founder setting a first price, the founder playbook Price a product before you have customers walks through the whole sequence. For services, see How to price services as a small business.
How Koji helps
Koji runs the price test inside an AI-moderated interview, so each point on the curve comes with the reasons behind it. What the report does for each of the four passes:
- Sample: under 30 interviews, the report says the curve is an early signal that steadies from about 30.
- Both ends: when 20% or more would buy even at the top price, the report suggests trying higher prices. When 20% or more would buy at none, it suggests lower ones.
- Near ties: prices that earn within 10% of the peak are reported as earning about the same, with the leader named as winning by a small margin. A line under the chart weighs the peak against a cheaper option: how much less it earns and how many more it sells to.
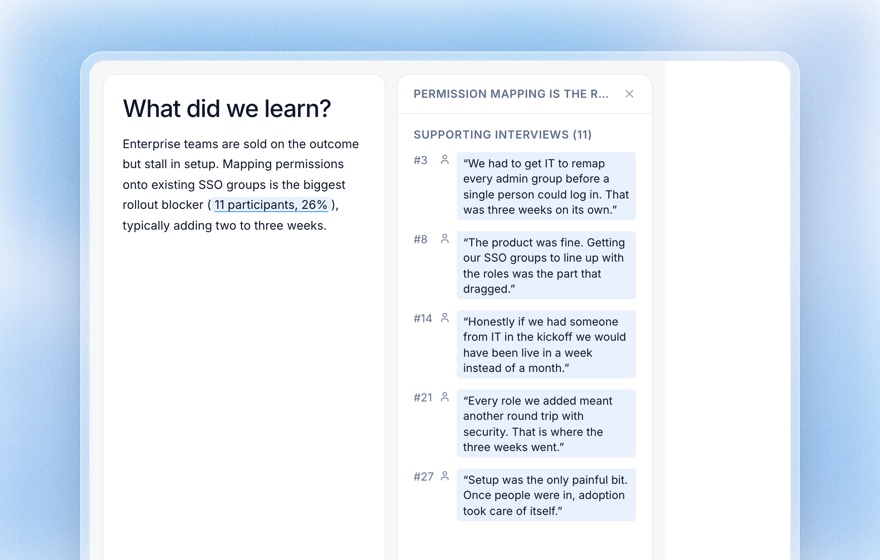
- Reasons: every price row shows how many people stopped there. Click it to read what they said. After the price walk, Koji asks each person why, in their own words, and the report groups those answers into themes with the quotes attached.
The setup sits next to every other kind of question. You enter 3 to 10 prices (5 to 7 evenly spaced is the recommendation), pick who counts as a buyer (by default "Probably would buy" or higher) and Koji starts each person at a random price in the middle of the ladder, so nobody anchors on the cheapest one. Most people see about three prices. It works in text and voice interviews. The price test setup guide covers every setting.
Compared with a survey tool, the main difference is the reasons. A survey can run the same ladder with branching logic, but you'd have to add open questions and code the answers yourself. Compared with a pricing consultant, it is faster and cheaper, at the cost of the large samples a consultant would field.
Common mistakes
- Announcing the peak as "the optimal price". With a flat top, it is one of several.
- Ignoring the ends. A ladder that stops too low hides the real ceiling.
- Blending segments. Read each buyer type on its own.
- Reading only the chart. The quotes at the biggest drop are the most useful part of the report.
- Skipping the behaviour test. Stated intent narrows the range, and only a real offer confirms it.
Related Resources
- Gabor-Granger Pricing Method: the method, its history and when to use it
- Set Up a Price Test in Koji: every setting explained
- Choosing the Prices to Test: how many price points, and how far apart
- Purchase Intent Scale: how the five-point buy question works
- Pricing Research Interviews: the conversation behind willingness to pay
- Structured Questions Guide: the price test next to scale, choice and ranking questions
Sources
- André Gabor and Clive W. J. Granger, "Price as an Indicator of Quality: Report on an Enquiry", Economica 33(129), 43 to 70, 1966.
- Michael V. Marn and Robert L. Rosiello, "Managing Price, Gaining Profit", Harvard Business Review, September to October 1992 (average economics of 2,463 companies in Compustat).
- McKinsey and Company, "The power of pricing" (S&P 1500 analysis).
- Madhavan Ramanujam and Georg Tacke, Monetizing Innovation, Wiley, 2016.
- Madhavan Ramanujam on Lenny's Podcast, "The art and science of pricing", December 2022.
Related Articles
Gabor-Granger Pricing Method: Find Your Revenue-Maximizing Price
A practical guide to the Gabor-Granger pricing method — how it works, a worked revenue-curve example, its limitations, how it compares to Van Westendorp and conjoint, and how to run it with AI.
Choosing the Prices to Test: How Many Price Points, and How Far Apart
How to build the price ladder for a Gabor-Granger price test: how many prices to use, where to set the floor and ceiling, how to space the steps, where people start and who counts as a buyer.
Set Up a Price Test in Koji: Every Setting Explained
How to add a Gabor-Granger price test to a Koji study: entering the price ladder, currency and unit, choosing who counts as a buyer, where participants start, and what to know before you publish.
Pricing Research Interviews: How to Understand What Customers Will Pay
Discover how to run qualitative pricing research interviews that reveal willingness to pay, price anchors, and the emotional logic behind buying decisions — beyond what surveys can surface.
Purchase Intent Scale: How to Ask "Would You Buy This?" and Read the Answer
How the 5-point purchase intent scale works, how to score it as top-box or top-2-box, what the research says about when intent predicts sales, the 11-point Juster probability scale and how to pair the score with the reasons behind it.
Structured Questions in AI Interviews
Mix quantitative data collection — scales, ratings, multiple choice, ranking — with AI-powered conversational follow-up in a single interview.