Choosing the Prices to Test: How Many Price Points, and How Far Apart
How to build the price ladder for a Gabor-Granger price test: how many prices to use, where to set the floor and ceiling, how to space the steps, where people start and who counts as a buyer.
Short answer: for a Gabor-Granger price test, use 5 to 7 prices, evenly spaced, running from a floor just above your cheapest credible alternative to a ceiling you suspect is too high. Fewer than 5 leaves big gaps where the best price could hide. More than 7 rarely helps, because the best price you can find is always one of the prices you tested, and the extra points mostly split the same answers more thinly. Set the ceiling high enough that some people turn it down: a ladder where most people still buy at the top price can't tell you where demand ends.
If you're a founder setting a first price, this page is the part most guides skip. The method is simple (show one price at a time, ask "would you buy at this price?", move up or down), but the answer can only be as good as the ladder you give it. Pick the wrong prices and the test will confidently tell you the best of a bad set.
Try it this week: write down three numbers before you read on: what your cheapest real alternative costs, what you'd love to charge, and a price that makes you nervous. Those three numbers are the skeleton of your ladder.
Why the ladder matters so much
Price is the lever with the most effect on profit. A McKinsey analysis of a typical S&P 1500 company found that a 1% price increase, with volume held steady, lifts operating profit by about 8%. Getting the number roughly right is worth the hour it takes to design the test properly.
Warren Buffett put the stakes more bluntly in his 2010 interview with the Financial Crisis Inquiry Commission: "The single most important decision in evaluating a business is pricing power. If you've got the power to raise prices without losing business to a competitor, you've got a very good business."
A Gabor-Granger test estimates that power for one offer. It can only see the prices you put on the ladder. Three things go wrong most often:
- The ceiling is too low. If most people still say yes at your highest price, the real limit is somewhere above it and the test can't tell you where. The "best price" it reports is just your top price.
- The floor is too high. If many people say no even at your lowest price, either the offer isn't landing or you're talking to the wrong people. Either way the demand curve has nothing to start from.
- The steps are too coarse. With 3 prices spread from €10 to €100, the best price lands on one of three numbers that are far apart. The true peak could be anywhere between them.
How many prices to test
Use 5 to 7. That's the standard advice for Gabor-Granger, and it's what Koji's editor recommends. Koji accepts between 3 and 10.
The reason more prices don't cost much is the way the test walks the ladder. Each participant doesn't see every price. They start somewhere in the middle and move up after a yes and down after a no, halving the gap each time, until the highest price they'd still buy at is pinned down. With 7 prices, that takes about 3 answers per person. With 10, it takes about 4. So the participant burden barely changes.
What does change is how your sample spreads out. Every price you add splits your participants' answers into more, smaller groups at the top of their range. With about 30 interviews, 5 to 7 prices give each point enough answers to see the shape of the curve. With 10 prices and 30 people, neighbouring points start to bounce around for no real reason.
| Prices | When it fits |
|---|---|
| 3 to 4 | You already know the range well and are choosing between a few real options |
| 5 to 7 | The default: a first price, a new tier, a price change |
| 8 to 10 | A wide range you know little about, and a sample well above 30 |
Where to put the floor and the ceiling
Start from evidence you already have, not from the price you hope for.
The floor: a little above the cheapest credible way your buyer solves the problem today. That might be a competitor's entry plan, a spreadsheet plus an hour of someone's time, or a freelancer's day rate. Make sure the floor also covers your costs. There is no point learning that people would buy at a price you can't afford to sell at.
The ceiling: a price that makes you uncomfortable. A good rule of thumb is that the top of the ladder should be a price you expect most people to turn down. If you're unsure, go higher. A ceiling that's too high costs you one wasted step for a few participants. A ceiling that's too low makes the whole result wrong.
The middle: your current price or the price you're leaning towards should sit near the middle of the ladder, not at an end. That gives the test room to move in both directions.
If you have no idea at all where the range is, run a Van Westendorp study first. Its four questions ask people what would be too cheap, a bargain, getting expensive and too expensive, which gives you a range to build the ladder in. See Gabor-Granger vs Van Westendorp for when to use each.
How far apart: spacing the steps
Evenly spaced works for most ladders. €19, €29, €39, €49, €59 is easy to read, easy to chart, and every step means the same thing.
Space by percentage when the range is wide. If your ceiling is more than about three times your floor (a rule of thumb, not a law), equal steps put too many prices at the expensive end, where small differences feel trivial to buyers, and too few at the cheap end, where they feel large. A ladder like €10, €15, €22, €33, €50 grows by about half each step and spreads the test's attention more evenly.
Keep price endings consistent. Either all prices end in 9 or none do. Mixing €29 with €40 tests the ending as well as the level, and you won't be able to tell which one moved the answer.
Match the unit to how you'll sell it. If you'll bill monthly, test monthly prices with "per month" next to them. If you'll sell annual plans, test annual prices. People don't do the conversion reliably in their heads.
Where each person starts on the ladder
The first price a participant sees anchors everything after it. In a well-known experiment, Dan Ariely, George Loewenstein and Drazen Prelec asked people whether they'd buy ordinary products at a price equal to the last two digits of their social security number. People with above-median numbers then stated values 57% to 107% higher than people with below-median numbers (Quarterly Journal of Economics, 2003). The authors concluded that demand curves "need not reveal true consumer preferences, in any normatively significant sense of the term."
You can't remove anchoring, but you can stop it pushing every answer the same way. Two habits help:
- Start people at different prices. If everyone starts at the cheapest price, the cheap anchor drags the whole curve down. Starting each person at a random price in the middle third of the ladder spreads the anchoring effect in both directions, so it mostly cancels out across the sample.
- Show the offer before the first price. People who know exactly what they're being asked to pay for anchor less on the number itself.
Who counts as a buyer
Each price is rated on a 5-point purchase-intent scale, from "Definitely would not buy" to "Definitely would buy". You decide which answers count as a yes.
The common rule is top-2-box: "Probably would buy" or higher. It's the default for good reason, but know what it does. People overstate what they'll pay when no money changes hands. A meta-analysis of 77 studies by Jonas Schmidt and Tammo Bijmolt found that stated willingness to pay ran 21% higher on average than what people paid when it was real (Journal of the Academy of Marketing Science, 2020), and the gap was larger for more expensive products.
So:
- Use "Probably" or higher for most tests and treat the result as directional.
- Use "Definitely" only when you need a conservative number, for example before committing to a price in a board plan.
- Use "Might or might not" and up only when you're exploring and want to see how many people are undecided.
Whatever you choose, keep it fixed for the whole study, and pair the result with a behavioural check before you commit: a live pricing page, a pre-order or a letter of intent.
A worked example
This is an illustrative example, not real study data.

Photo by Wafiq Raza on Unsplash
A two-person team is pricing a scheduling tool for small clinics. Today, clinics either use a free calendar plus phone calls or pay about €35 a month for a larger practice-management suite. The team hopes to charge around €49.
- Floor: €29. Below the suite's €35, above the team's costs per account.
- Ceiling: €99. Roughly double their hope, and a price they expect most clinics to refuse.
- Count and spacing: 7 prices, all ending in 9, in even €10 steps with one wider last step to stretch the ceiling: €29, €39, €49, €59, €69, €79, €99. The ceiling is just over three times the floor, so they considered percentage spacing, but even steps cover the €29 to €79 band they care about most in enough detail.
- The middle: their hoped-for €49 sits near the middle, with room on both sides.
- Unit: "per clinic, per month".
- Who counts: "Probably would buy" or higher.
After 32 interviews, if a large share still says yes at €99, they'd rerun with a higher ceiling. If most say no at €29, the problem isn't price, and the "why" answers will usually say what it is.
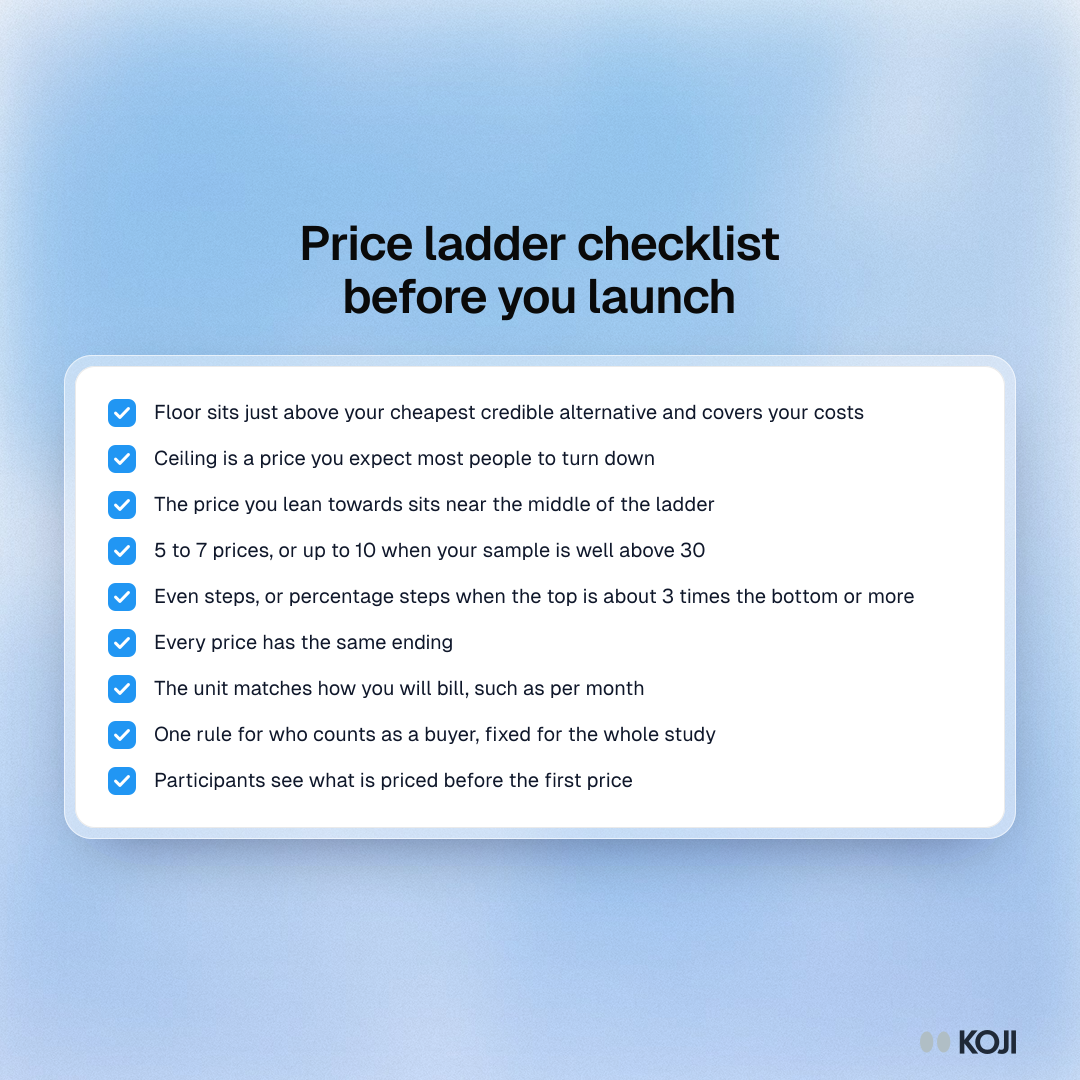
Checks before you launch
Run through these before the first participant sees the ladder. Most can't be changed once answers come in, because changing the prices would mix two different tests in one result.
How Koji helps
Koji has a Price Test (Gabor-Granger) question type that runs the ladder inside an AI interview, in text or voice (not on phone calls). You can set one up yourself from a free account, next to any other question in the study.
- Building the ladder. Type or paste your prices (3 to 10). The editor suggests 5 to 7, evenly spaced. Choose a currency per question and a unit such as "per month".
- Who counts as a buyer. Pick "Probably or higher" (recommended), "Definitely only" or "Might or higher".
- Where people start. By default each participant starts at a random price in the middle of the ladder, so nobody anchors on the cheapest. You can let the start fall anywhere instead.
- The why. After the walk finds a participant's highest price, the AI interviewer asks why in their own words, so you hear what they compared you to and what the price would need to include.
- Show the offer. Attach an image to the question (a pricing page, a mockup, packaging) and participants see it with each price.
- Locked prices. The ladder locks once interviews start, so everyone sees the same prices.
- The report shows the share who would buy at each price, the revenue each price implies and the price that earns the most, with the quotes behind each point. It tells you when your ceiling may be too low and when a cheaper price earns nearly as much. It reads best from about 30 interviews and is labelled directional.
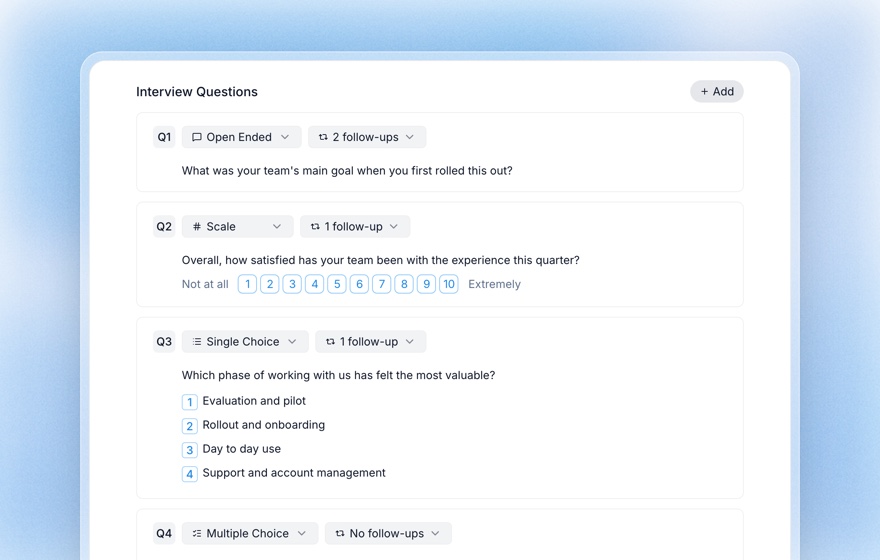
Not sure what to put on the ladder? Ask the research assistant ("help me test pricing for a clinic scheduling tool") and it drafts the study, price ladder included, for you to adjust.
Related Resources
- Gabor-Granger Pricing Method: the full method, with a worked revenue curve
- Purchase Intent Scale: how to read the 5-point scale behind every answer
- Van Westendorp Price Sensitivity Meter: find a range before you build a ladder
- Structured Questions Guide: the price test next to scale, choice and ranking questions
- Pricing Research Interviews: the qualitative side of willingness to pay
Sources
- McKinsey & Company, "The power of pricing", McKinsey Quarterly
- Warren Buffett, interview with the Financial Crisis Inquiry Commission, 2010 (released 2011)
- Dan Ariely, George Loewenstein and Drazen Prelec, "Coherent Arbitrariness: Stable Demand Curves Without Stable Preferences", Quarterly Journal of Economics 118(1), 2003
- Jonas Schmidt and Tammo H. A. Bijmolt, "Accurately measuring willingness to pay for consumer goods: a meta-analysis of the hypothetical bias", Journal of the Academy of Marketing Science 48, 2020
Related Articles
Gabor-Granger Pricing Method: Find Your Revenue-Maximizing Price
A practical guide to the Gabor-Granger pricing method — how it works, a worked revenue-curve example, its limitations, how it compares to Van Westendorp and conjoint, and how to run it with AI.
Pricing Research Interviews: How to Understand What Customers Will Pay
Discover how to run qualitative pricing research interviews that reveal willingness to pay, price anchors, and the emotional logic behind buying decisions — beyond what surveys can surface.
Purchase Intent Scale: How to Ask "Would You Buy This?" and Read the Answer
How the 5-point purchase intent scale works, how to score it as top-box or top-2-box, what the research says about when intent predicts sales, the 11-point Juster probability scale and how to pair the score with the reasons behind it.
Structured Questions in AI Interviews
Mix quantitative data collection — scales, ratings, multiple choice, ranking — with AI-powered conversational follow-up in a single interview.
Van Westendorp Price Sensitivity Meter: The Four-Question Pricing Research Method
The Van Westendorp Price Sensitivity Meter uses four questions to identify the optimal price for any product. Learn how to run the PSM with AI interviews at scale and combine the four numbers with qualitative reasoning.
5-Point vs 7-Point Likert Scale: How Many Scale Points Should You Use? (2026)
A decision guide for rating-scale length — what the reliability research actually says about 5 vs 7 points, the odd-vs-even and neutral-midpoint debates, when each fits, and how AI follow-ups make any scale richer.