Flowchart
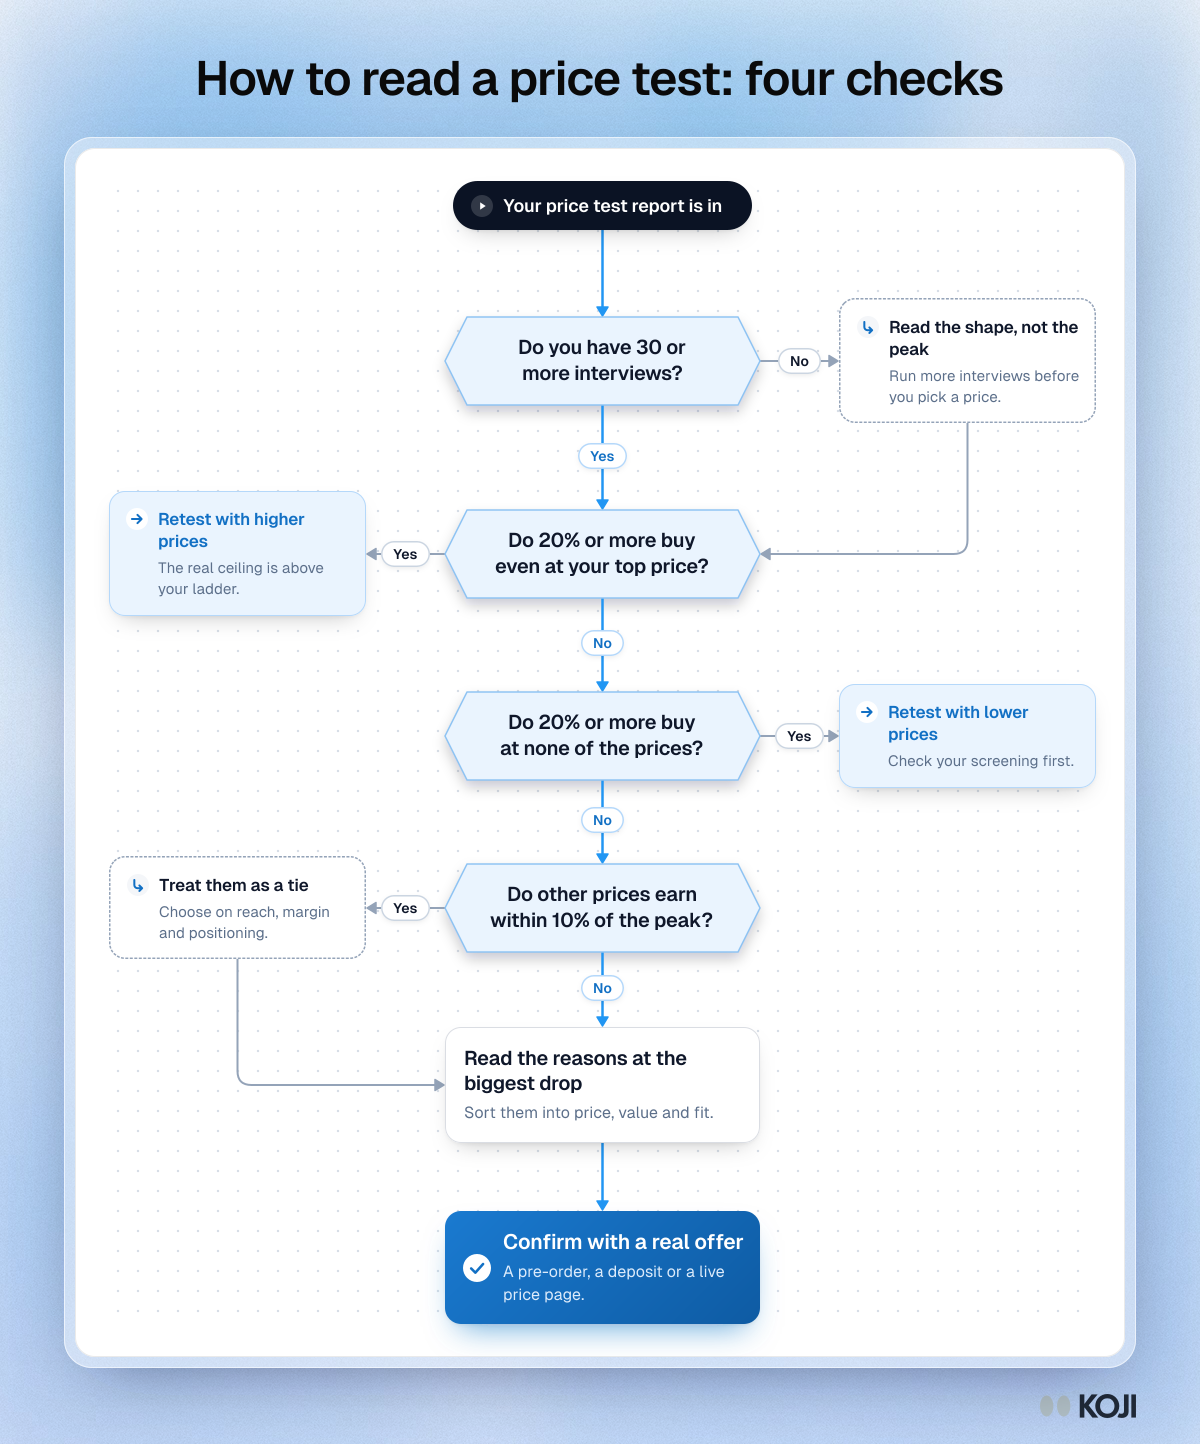
How to read a price test: four checks
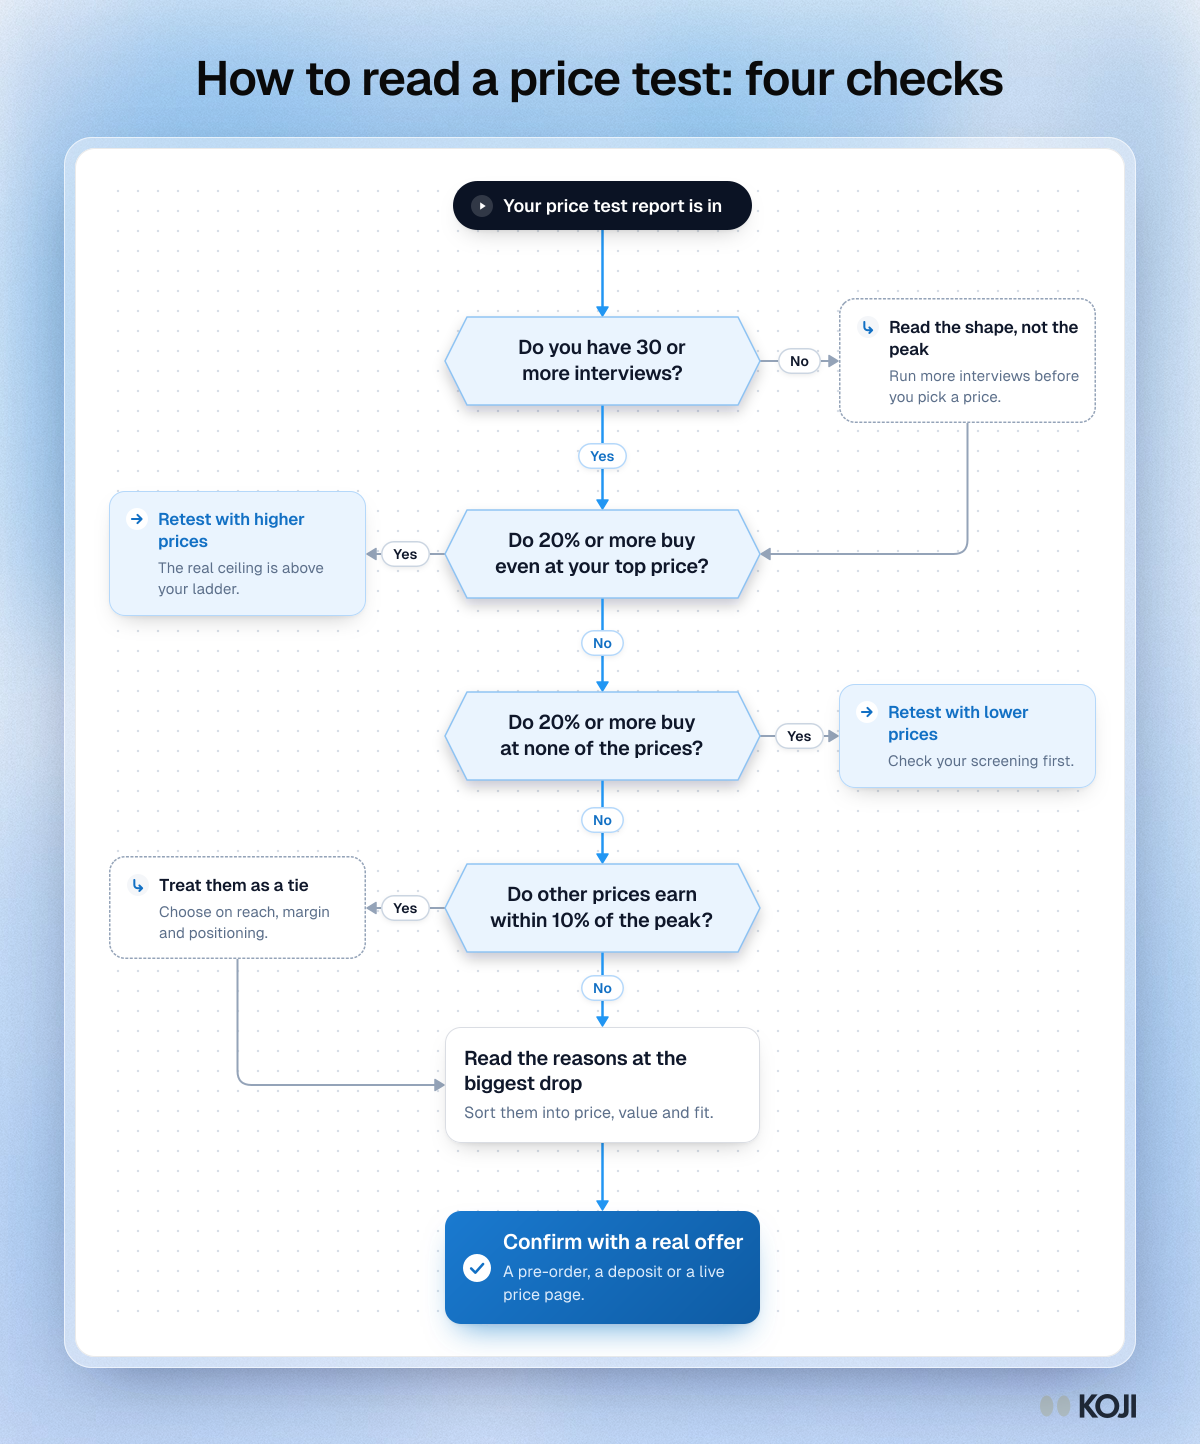
A flowchart for reading a Gabor-Granger price test result. It checks the sample size, both ends of the price ladder and near ties in revenue, then sends you to the reasons behind the biggest drop in demand and a real-world test. Use it before you choose a price from a demand and revenue curve. In Koji, the price test report flags each of these checks for you.
Where this appears
What's in this flowchart
Start: Your price test report is in
- Do you have 30 or more interviews?
- Yes: go to 2.
- No: Read the shape, not the peak. Run more interviews before you pick a price. Then go to 2.
- Do 20% or more buy even at your top price?
- No: go to 3.
- Yes: Retest with higher prices. The real ceiling is above your ladder.
- Do 20% or more buy at none of the prices?
- No: go to 4.
- Yes: Retest with lower prices. Check your screening first.
- Do other prices earn within 10% of the peak?
- No: go to 5.
- Yes: Treat them as a tie. Choose on reach, margin and positioning. Then go to 5.
- Read the reasons at the biggest drop. Sort them into price, value and fit.
- Finish: Confirm with a real offer. A pre-order, a deposit or a live price page.
Use this image
Free to use in your docs, decks and posts under CC BY 4.0, as long as you credit Koji with a link to this page. To embed it, paste this into your page:
html
<a href="https://www.koji.so/visuals/how-to-read-a-price-test-flowchart"><img src="https://www.koji.so/visuals/how-to-read-a-price-test-flowchart/how-to-read-a-price-test-flowchart.png" alt="Flowchart for reading a price test: check the sample and both ends of the ladder, treat near ties as ties, read the reasons, then confirm with a real offer." width="1200" height="1444" /></a>
<p>Source: <a href="https://www.koji.so/visuals/how-to-read-a-price-test-flowchart">How to read a price test: four checks</a>, Koji</p>