Column chart
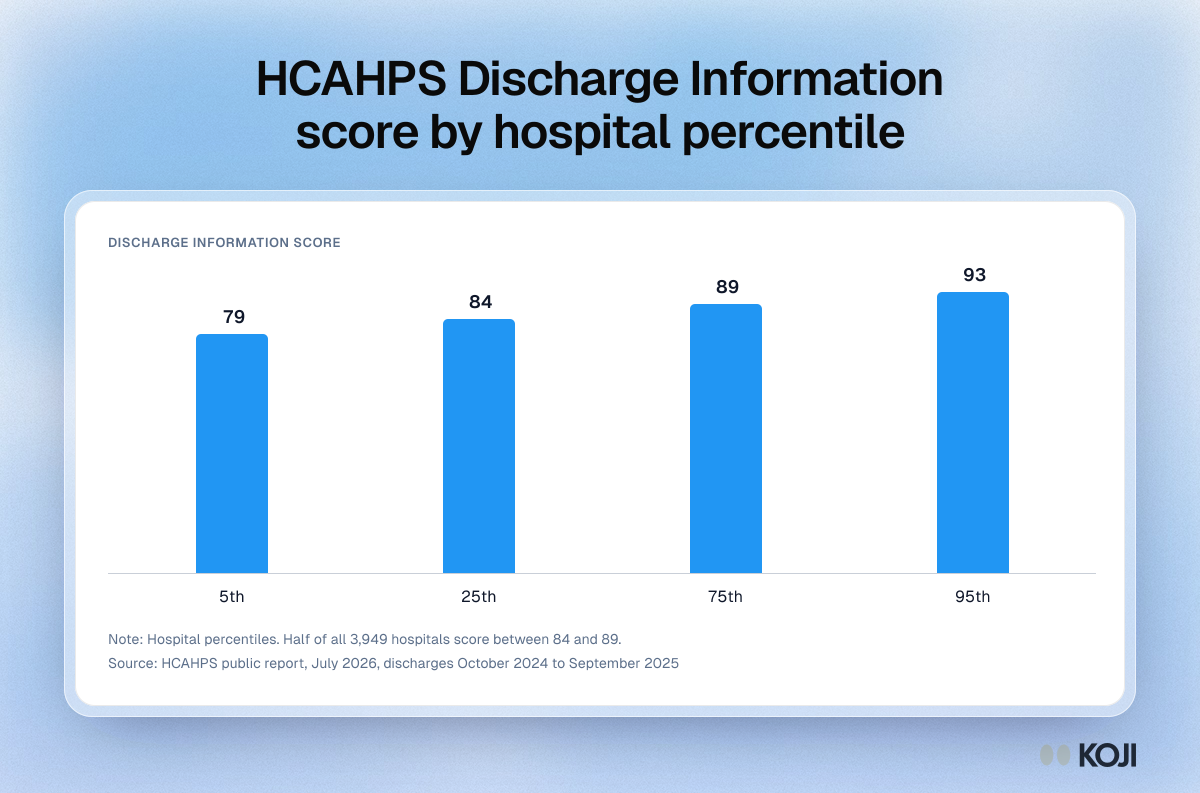
HCAHPS Discharge Information score by hospital percentile
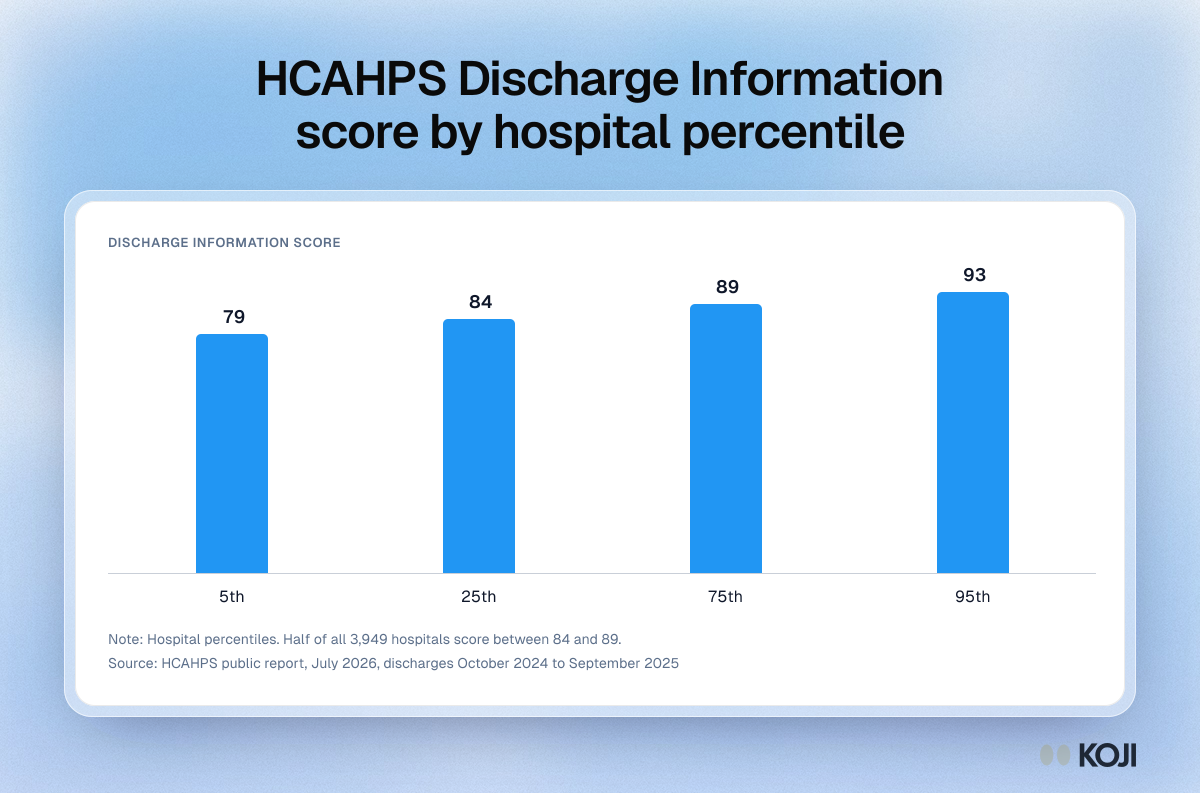
A column chart of the HCAHPS Discharge Information measure from the July 2026 public report, covering 3,949 US hospitals and discharges from October 2024 to September 2025. The whole distribution from the 5th to the 95th percentile spans 14 points, and half of all hospitals sit inside five. It shows why league tables built on a compressed satisfaction measure, such as a franchise location scorecard, mostly rank noise.
Where this appears
What's in this column chart
| Discharge Information score | |
|---|---|
| 5th | 79 |
| 25th | 84 |
| 75th | 89 |
| 95th | 93 |
Hospital percentiles. Half of all 3,949 hospitals score between 84 and 89.
Use this image
Free to use in your docs, decks and posts under CC BY 4.0, as long as you credit Koji with a link to this page. To embed it, paste this into your page:
html
<a href="https://www.koji.so/visuals/hcahps-discharge-information-score-by-percentile"><img src="https://www.koji.so/visuals/hcahps-discharge-information-score-by-percentile/hcahps-discharge-information-score-by-percentile.png" alt="Column chart of HCAHPS Discharge Information scores by hospital percentile: 79 at the 5th, 84 at the 25th, 89 at the 75th and 93 at the 95th." width="1200" height="793" /></a>
<p>Source: <a href="https://www.koji.so/visuals/hcahps-discharge-information-score-by-percentile">HCAHPS Discharge Information score by hospital percentile</a>, Koji</p>