Column chart
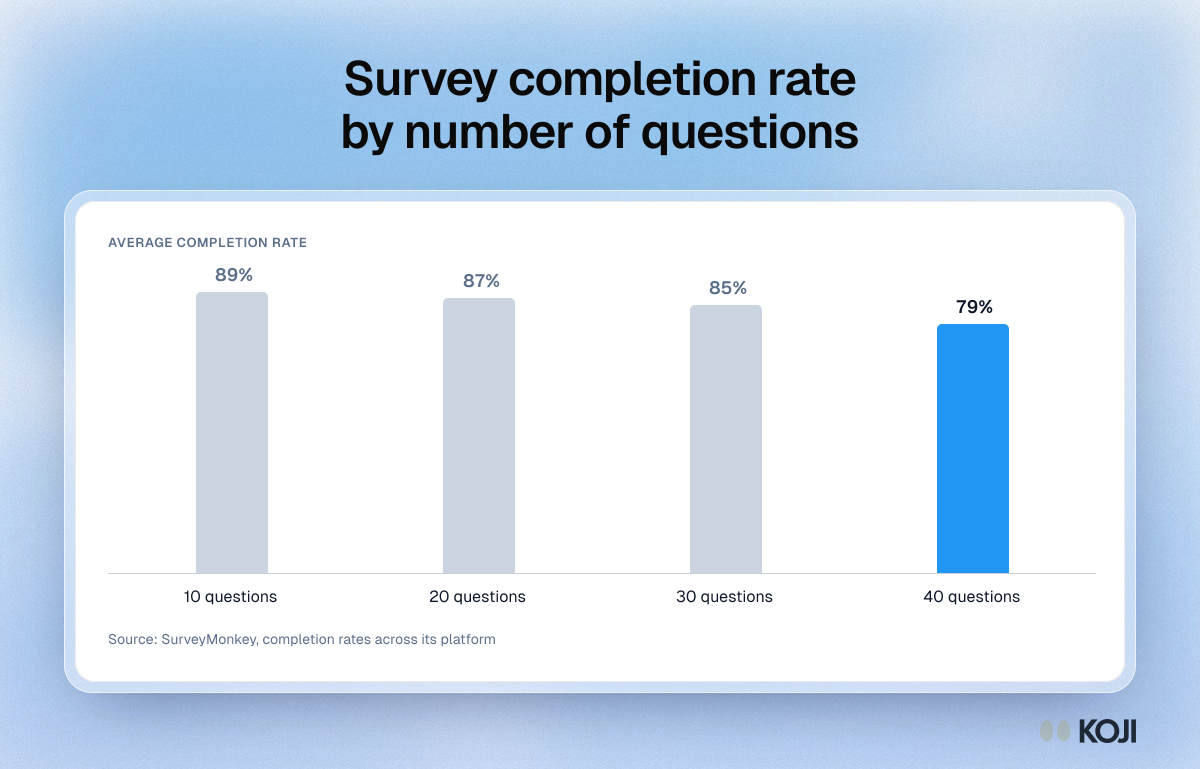
Survey completion rate by number of questions
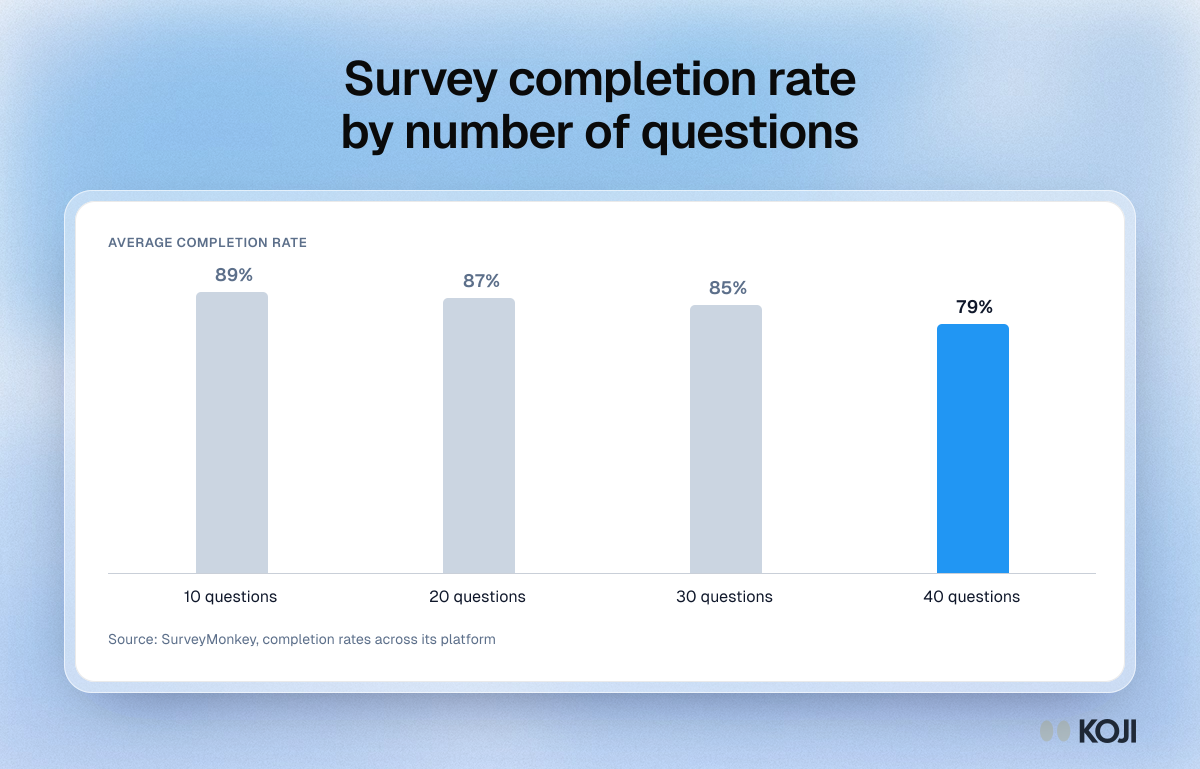
A column chart of SurveyMonkey data on how average survey completion falls as surveys get longer: 89% for 10 questions, 87% for 20, 85% for 30 and 79% for 40. Use it when deciding how many questions a survey can carry, or to show a stakeholder what each extra question costs. The people who finish long surveys are also a less representative group. Koji offers adaptive AI interviews that ask follow-ups only when an answer calls for one.
Where this appears
What's in this column chart
| Average completion rate | |
|---|---|
| 10 questions | 89% |
| 20 questions | 87% |
| 30 questions | 85% |
| 40 questions | 79% |
Use this image
Free to use in your docs, decks and posts under CC BY 4.0, as long as you credit Koji with a link to this page. To embed it, paste this into your page:
html
<a href="https://www.koji.so/visuals/survey-completion-rate-by-number-of-questions"><img src="https://www.koji.so/visuals/survey-completion-rate-by-number-of-questions/survey-completion-rate-by-number-of-questions.png" alt="Column chart of average survey completion rate by length: 89% at 10 questions, 87% at 20, 85% at 30 and 79% at 40 questions." width="1200" height="769" /></a>
<p>Source: <a href="https://www.koji.so/visuals/survey-completion-rate-by-number-of-questions">Survey completion rate by number of questions</a>, Koji</p>