Column chart
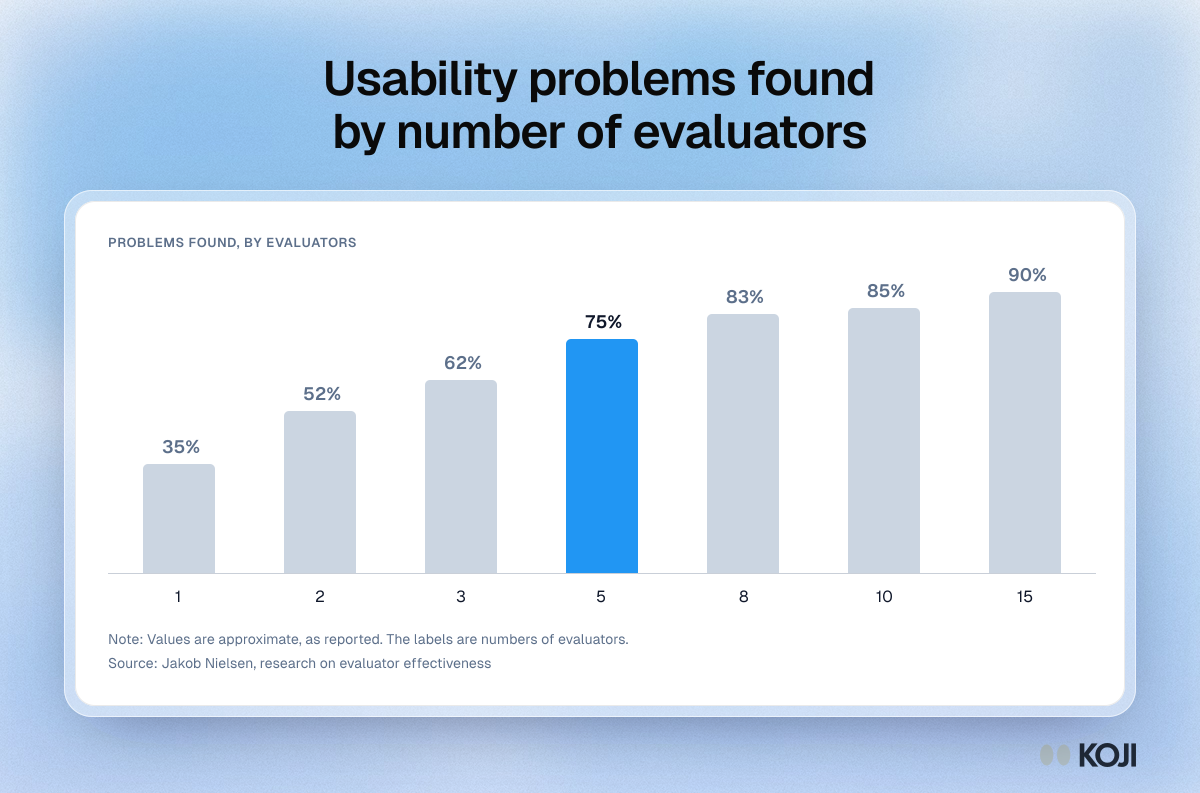
Usability problems found by number of evaluators
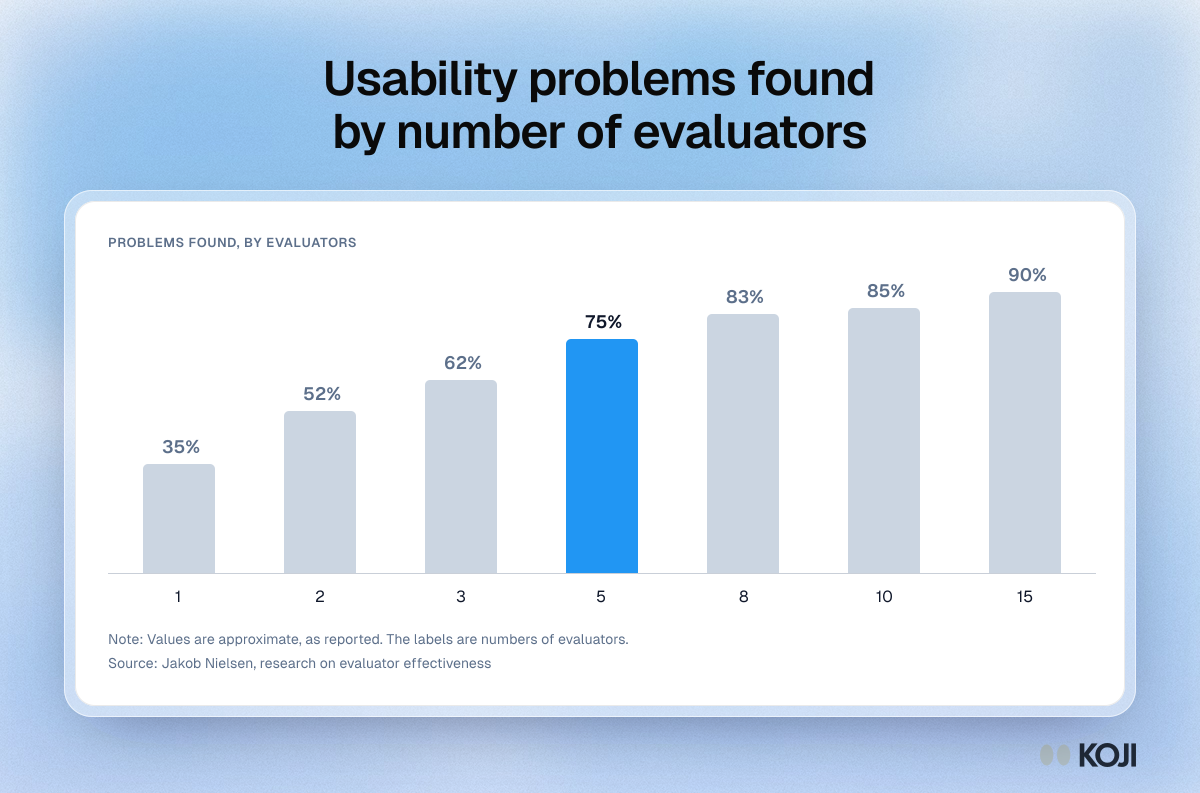
A column chart of how many usability problems a heuristic evaluation finds as you add evaluators, from Nielsen's research on evaluator effectiveness: about 35% with one evaluator, 52% with two, 62% with three, 75% with five, 83% with eight, 85% with ten and 90% with fifteen. It shows the diminishing returns that make three to five evaluators the practical choice. Teams can use it to staff an expert review, and Koji to check the findings with real users.
Where this appears
What's in this column chart
| Share of problems found | |
|---|---|
| 1 | 35% |
| 2 | 52% |
| 3 | 62% |
| 5 | 75% |
| 8 | 83% |
| 10 | 85% |
| 15 | 90% |
Values are approximate, as reported. The labels are numbers of evaluators.
Use this image
Free to use in your docs, decks and posts under CC BY 4.0, as long as you credit Koji with a link to this page. To embed it, paste this into your page:
html
<a href="https://www.koji.so/visuals/usability-problems-found-by-number-of-evaluators"><img src="https://www.koji.so/visuals/usability-problems-found-by-number-of-evaluators/usability-problems-found-by-number-of-evaluators.png" alt="Column chart of usability problems found by number of evaluators: about 35% with 1, 62% with 3, 75% with 5, 85% with 10 and 90% with 15." width="1200" height="793" /></a>
<p>Source: <a href="https://www.koji.so/visuals/usability-problems-found-by-number-of-evaluators">Usability problems found by number of evaluators</a>, Koji</p>