Flowchart
Persevere, pivot or kill: deciding after an experiment
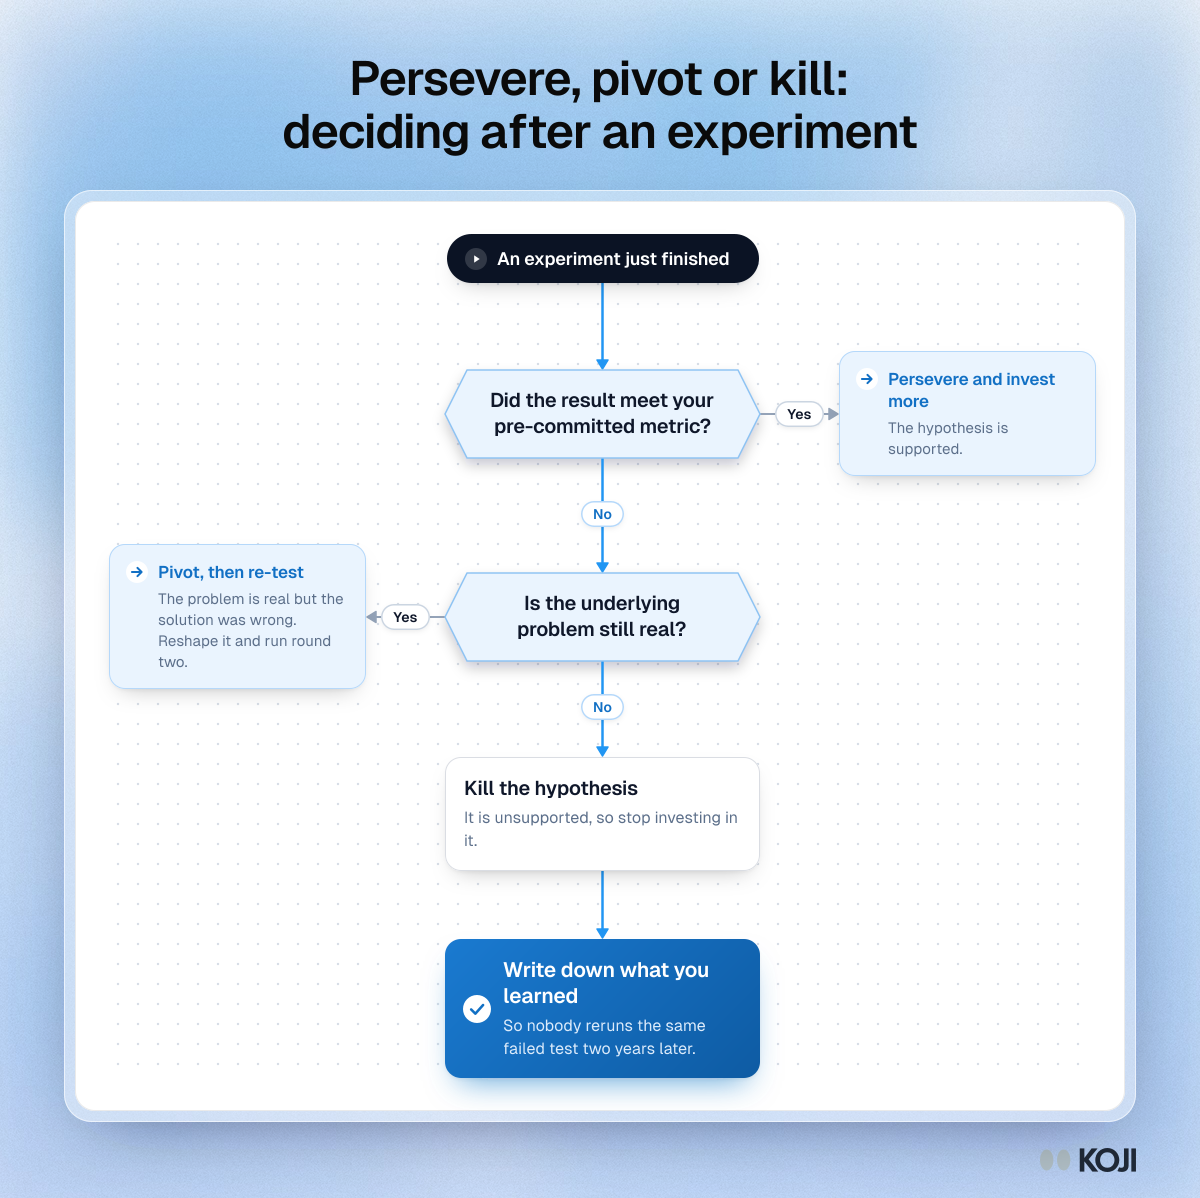
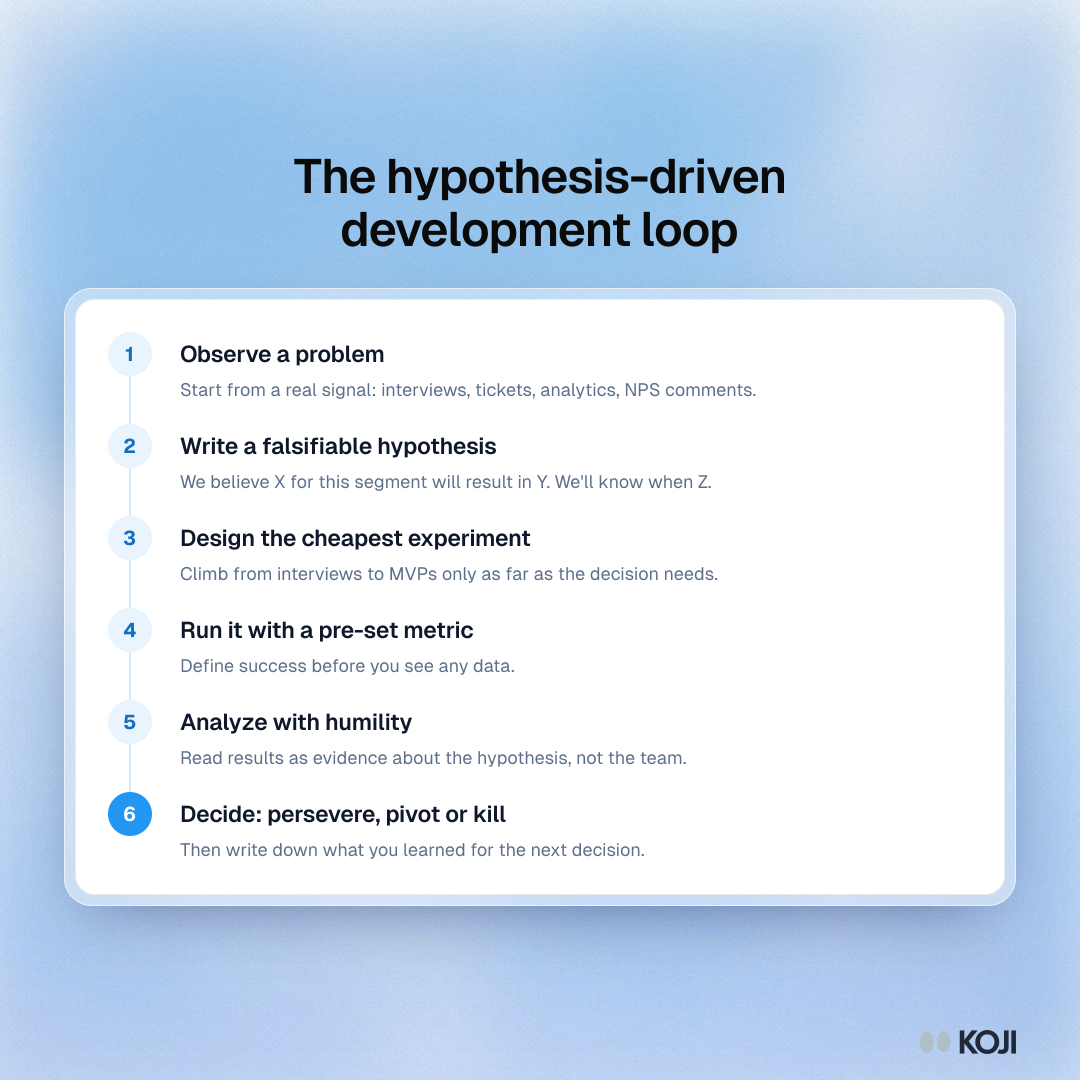
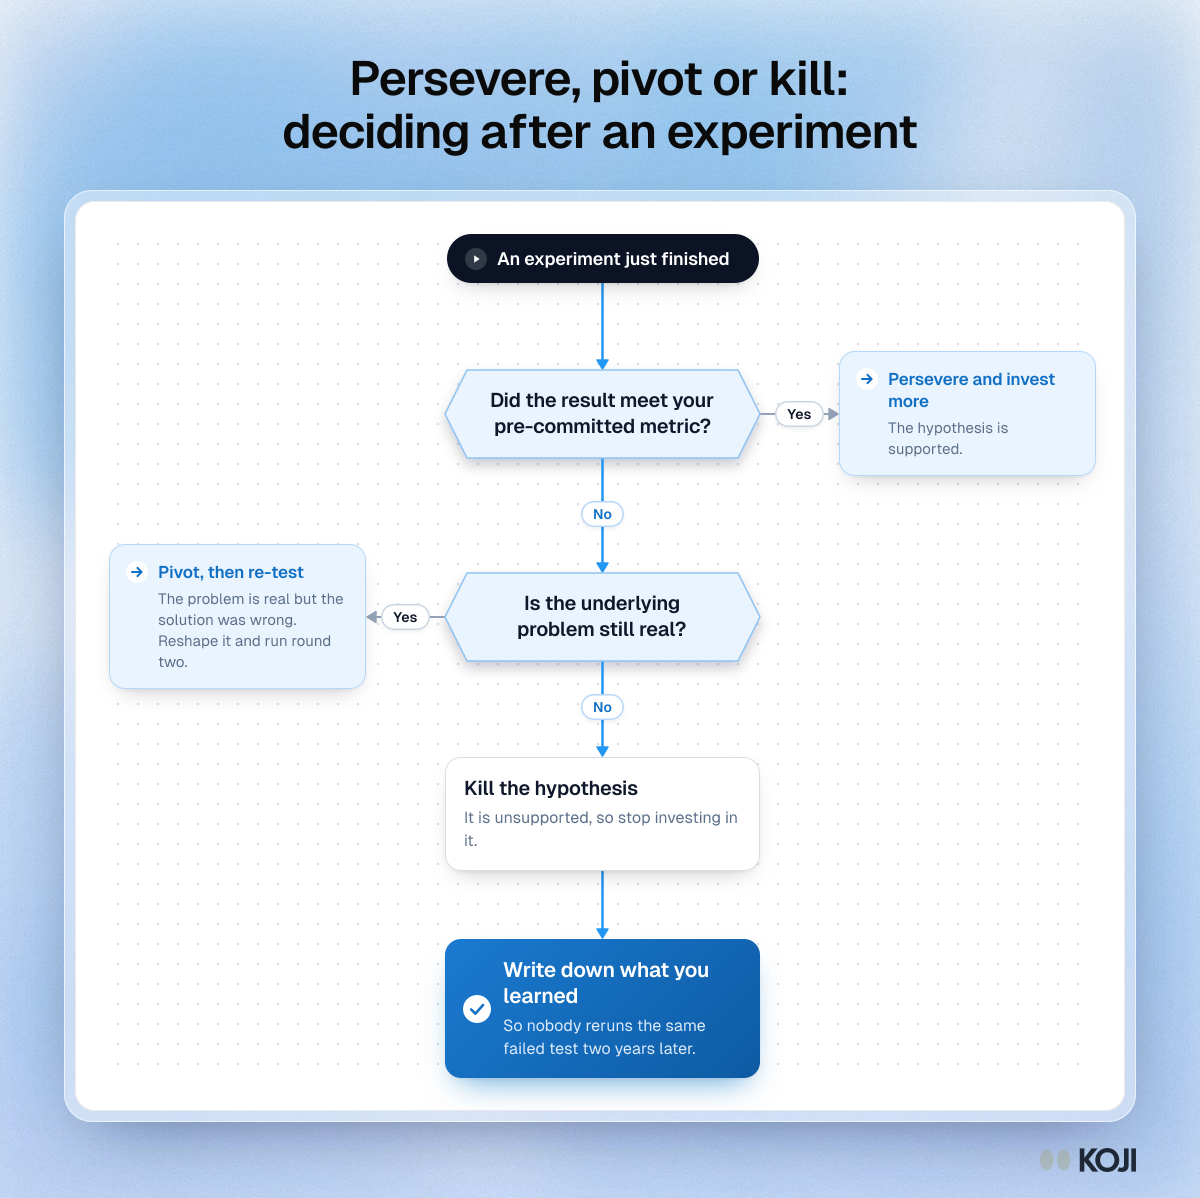
A decision flowchart for the last step of hypothesis-driven development. After an experiment, check the result against the metric you committed to in advance. If it passed, persevere. If it failed but the problem is still real, pivot and test again. Otherwise kill the idea, and write down what you learned either way. Koji helps with the pivot question by running quick follow-up interviews that ask customers why the test missed.
Where this appears
What's in this flowchart
Start: An experiment just finished
- Did the result meet your pre-committed metric?
- No: go to 2.
- Yes: Persevere and invest more. The hypothesis is supported.
- Is the underlying problem still real?
- No: go to 3.
- Yes: Pivot, then re-test. The problem is real but the solution was wrong. Reshape it and run round two.
- Kill the hypothesis. It is unsupported, so stop investing in it.
- Finish: Write down what you learned. So nobody reruns the same failed test two years later.
Use this image
Free to use in your docs, decks and posts under CC BY 4.0, as long as you credit Koji with a link to this page. To embed it, paste this into your page:
html
<a href="https://www.koji.so/visuals/hypothesis-experiment-persevere-pivot-or-kill-flowchart"><img src="https://www.koji.so/visuals/hypothesis-experiment-persevere-pivot-or-kill-flowchart/hypothesis-experiment-persevere-pivot-or-kill-flowchart.png" alt="Flowchart for deciding after a product experiment: two questions lead to persevere, pivot or kill, and every path ends in writing down the learning." width="1200" height="1198" /></a>
<p>Source: <a href="https://www.koji.so/visuals/hypothesis-experiment-persevere-pivot-or-kill-flowchart">Persevere, pivot or kill: deciding after an experiment</a>, Koji</p>