Bar chart
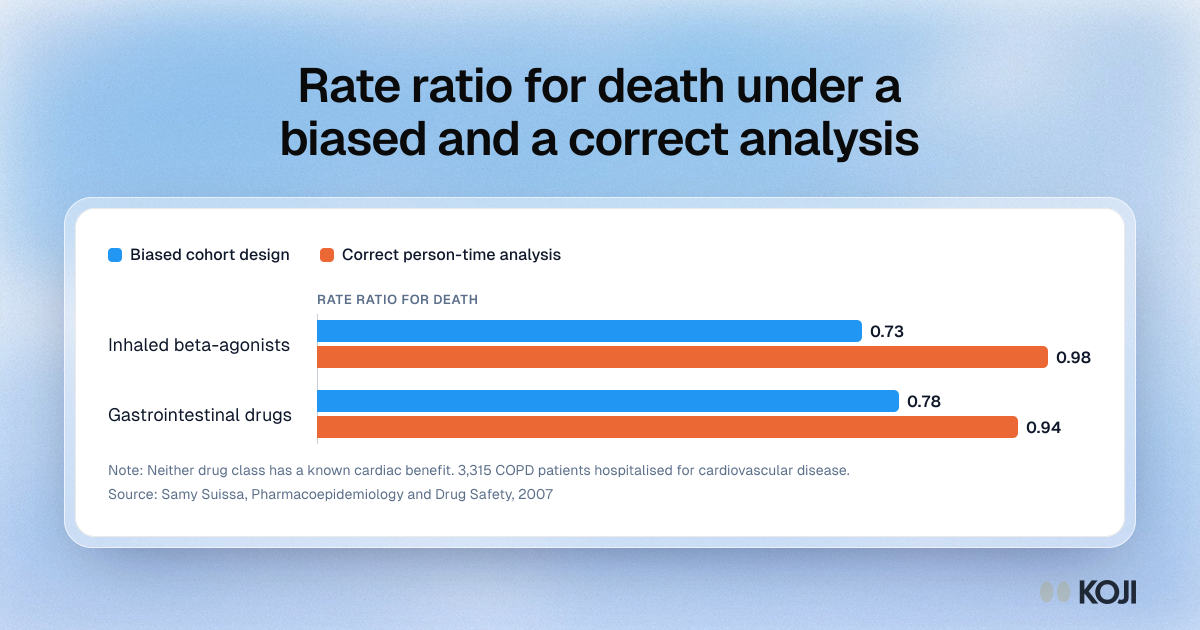
Rate ratio for death under a biased and a correct analysis
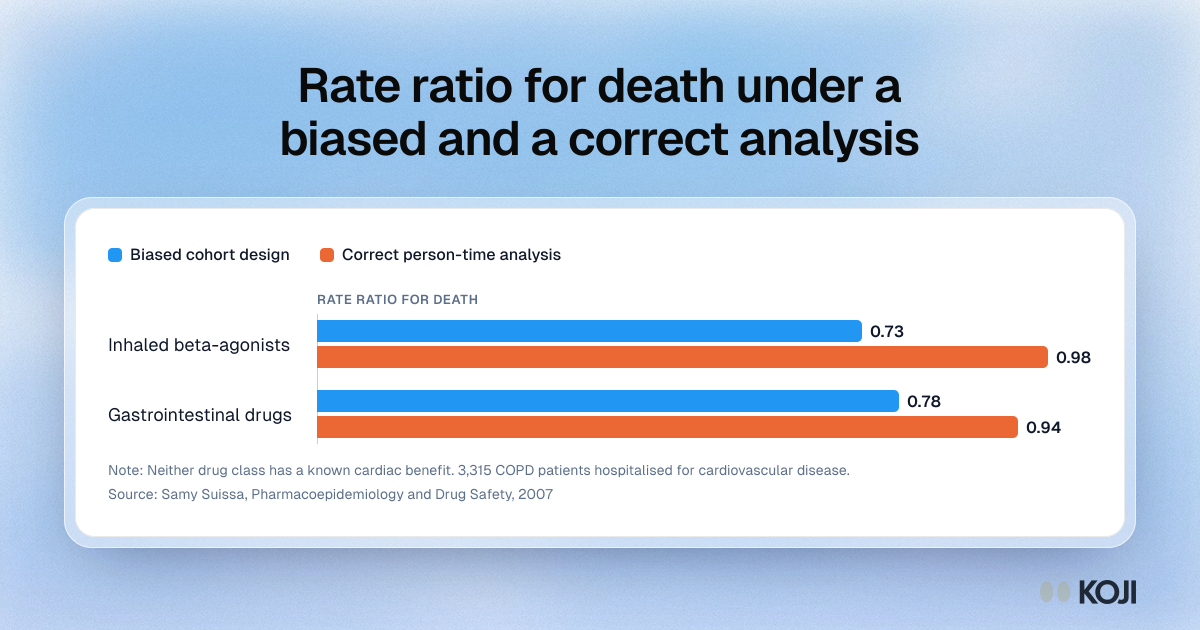
Samy Suissa's 2007 study of 3,315 COPD patients in the Saskatchewan Health databases tested two drug classes with no known cardiac benefit. Under a cohort design with immortal time, both appeared to cut deaths, with rate ratios of 0.73 and 0.78. Allocating person-time correctly gave 0.98 and 0.94. Product teams can use it to show why a feature adoption chart can invent a retention effect.
Where this appears
What's in this bar chart
| Biased cohort design | Correct person-time analysis | |
|---|---|---|
| Inhaled beta-agonists | 0.73 | 0.98 |
| Gastrointestinal drugs | 0.78 | 0.94 |
Neither drug class has a known cardiac benefit. 3,315 COPD patients hospitalised for cardiovascular disease.
Use this image
Free to use in your docs, decks and posts under CC BY 4.0, as long as you credit Koji with a link to this page. To embed it, paste this into your page:
html
<a href="https://www.koji.so/visuals/immortal-time-bias-rate-ratios-biased-vs-correct"><img src="https://www.koji.so/visuals/immortal-time-bias-rate-ratios-biased-vs-correct/immortal-time-bias-rate-ratios-biased-vs-correct.png" alt="Bar chart of rate ratios for death: 0.73 and 0.78 under a biased cohort design, 0.98 and 0.94 once person-time is allocated correctly." width="1200" height="630" /></a>
<p>Source: <a href="https://www.koji.so/visuals/immortal-time-bias-rate-ratios-biased-vs-correct">Rate ratio for death under a biased and a correct analysis</a>, Koji</p>