Bar chart
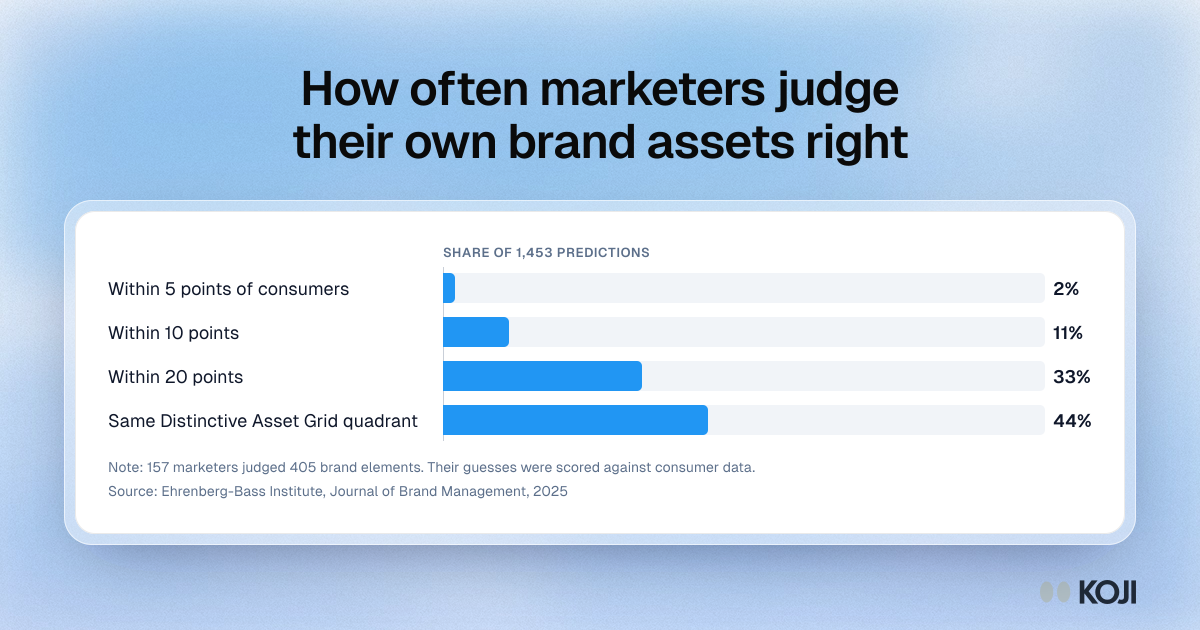
How often marketers judge their own brand assets right
Marketer predictions of brand element fame and uniqueness compared with what consumers said
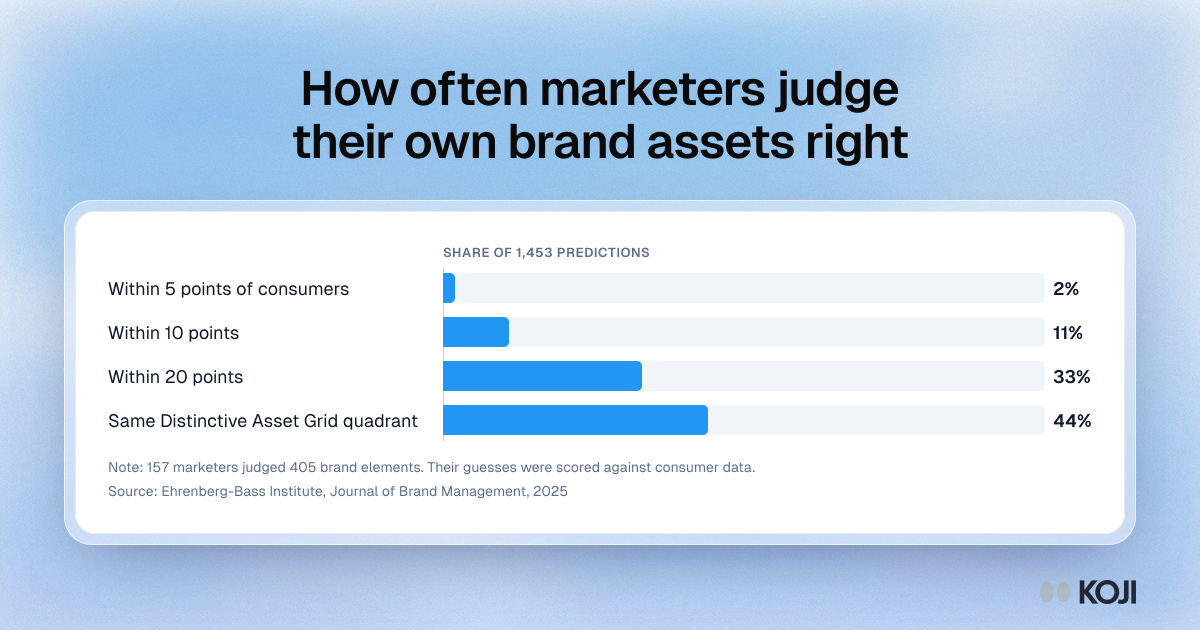
Results from a 2025 Ehrenberg-Bass Institute study in the Journal of Brand Management: 157 marketing professionals predicted how famous and unique 405 brand elements were, and those guesses were compared with consumer data. Few predictions came close. Use it to make the case for testing logos, colours, characters and packs with customers before a rebrand. Koji runs those interviews with timed image views.
Where this appears
What's in this bar chart
| Share of predictions | |
|---|---|
| Within 5 points of consumers | 2% |
| Within 10 points | 11% |
| Within 20 points | 33% |
| Same Distinctive Asset Grid quadrant | 44% |
157 marketers judged 405 brand elements. Their guesses were scored against consumer data.
Use this image
Free to use in your docs, decks and posts under CC BY 4.0, as long as you credit Koji with a link to this page. To embed it, paste this into your page:
html
<a href="https://www.koji.so/visuals/marketers-misjudge-brand-assets-chart"><img src="https://www.koji.so/visuals/marketers-misjudge-brand-assets-chart/marketers-misjudge-brand-assets-chart.png" alt="Bar chart: of 1,453 marketer predictions, 2% came within 5 points of consumer scores, 11% within 10, 33% within 20 and 44% in the same quadrant." width="1200" height="630" /></a>
<p>Source: <a href="https://www.koji.so/visuals/marketers-misjudge-brand-assets-chart">How often marketers judge their own brand assets right</a>, Koji</p>