Column chart
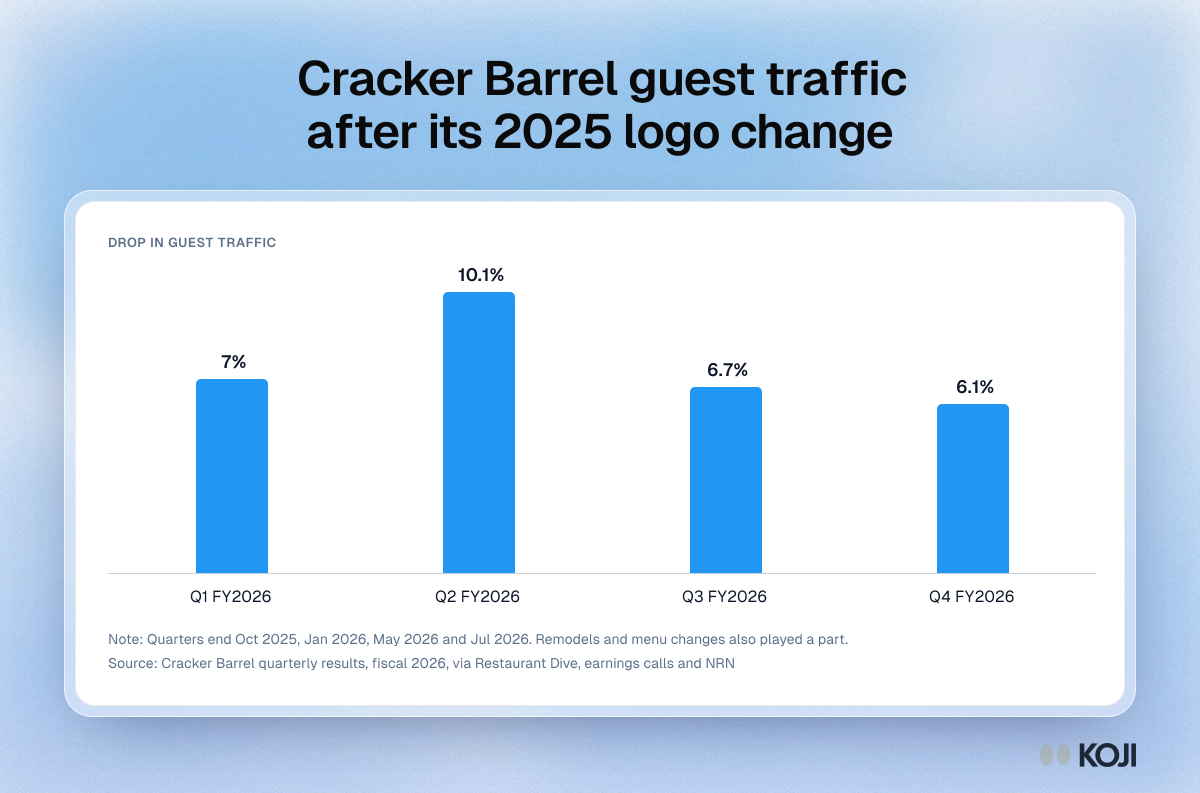
Cracker Barrel guest traffic after its 2025 logo change
Year-on-year drop in guest traffic for each fiscal quarter after the August 2025 rebrand and reversal
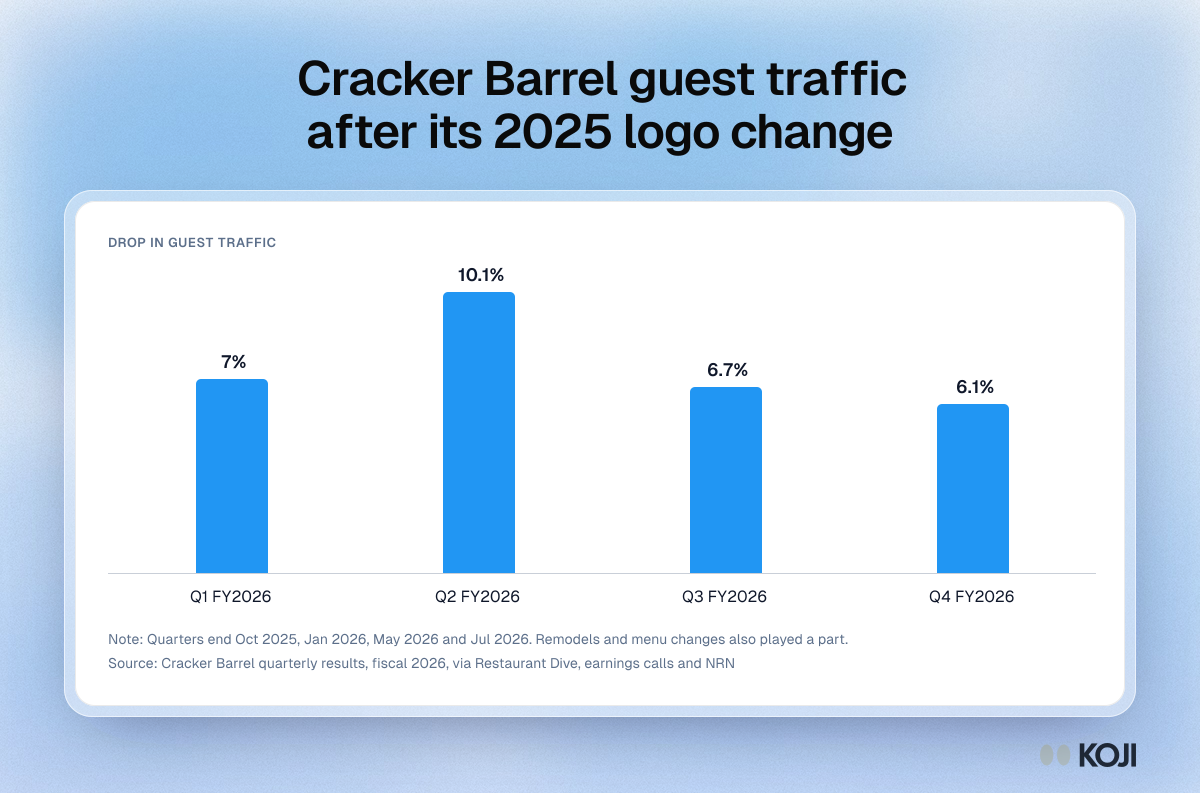
How far Cracker Barrel guest traffic fell, year on year, in each fiscal quarter after its August 2025 logo change was announced and then reversed. Brand and rebrand teams use it as a reminder that a backlash can outlast the reversal. Not all of the drop came from the logo: the chain was also remodelling restaurants and changing its menu. Koji helps brand teams interview loyal and lapsed customers about a new identity before the reveal.
Where this appears
What's in this column chart
| Drop in guest traffic | |
|---|---|
| Q1 FY2026 | 7% |
| Q2 FY2026 | 10.1% |
| Q3 FY2026 | 6.7% |
| Q4 FY2026 | 6.1% |
Quarters end Oct 2025, Jan 2026, May 2026 and Jul 2026. Remodels and menu changes also played a part.
Use this image
Free to use in your docs, decks and posts under CC BY 4.0, as long as you credit Koji with a link to this page. To embed it, paste this into your page:
<a href="https://www.koji.so/visuals/cracker-barrel-traffic-after-logo-change"><img src="https://www.koji.so/visuals/cracker-barrel-traffic-after-logo-change/cracker-barrel-traffic-after-logo-change.png" alt="Column chart of Cracker Barrel guest traffic declines by fiscal quarter after its 2025 logo change: about 7%, 10.1%, 6.7% and 6.1%." width="1200" height="793" /></a>
<p>Source: <a href="https://www.koji.so/visuals/cracker-barrel-traffic-after-logo-change">Cracker Barrel guest traffic after its 2025 logo change</a>, Koji</p>