Column chart
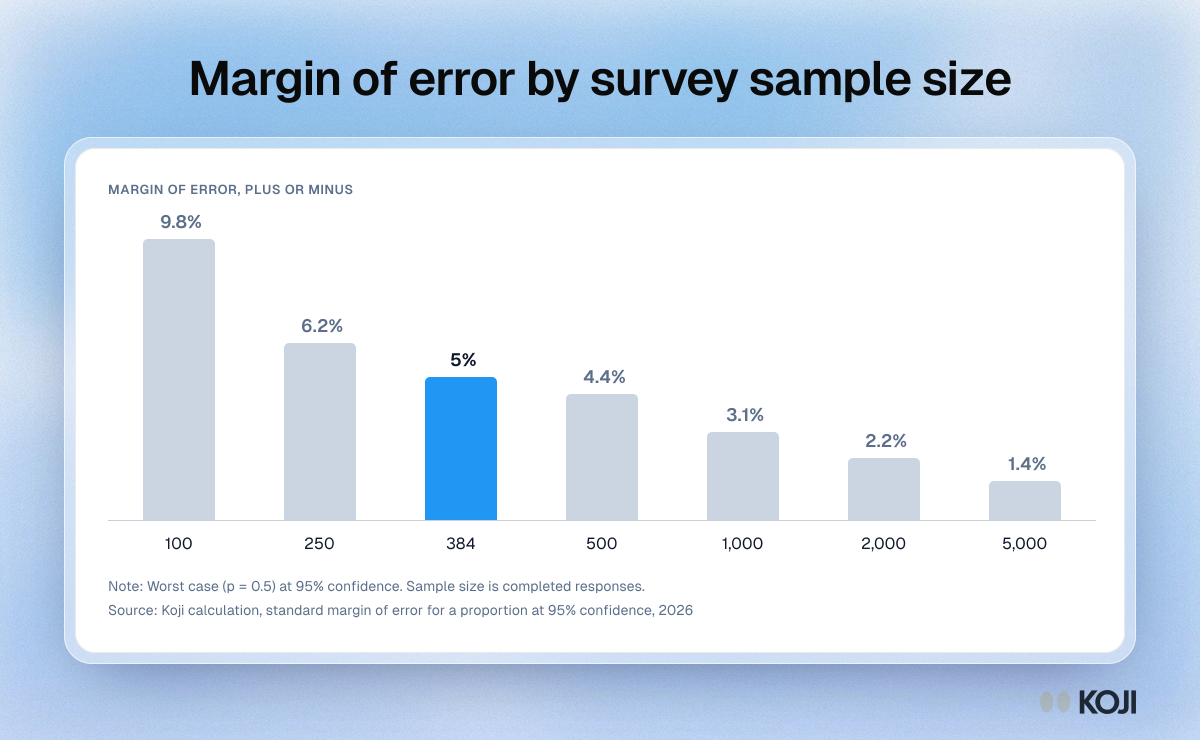
Margin of error by survey sample size
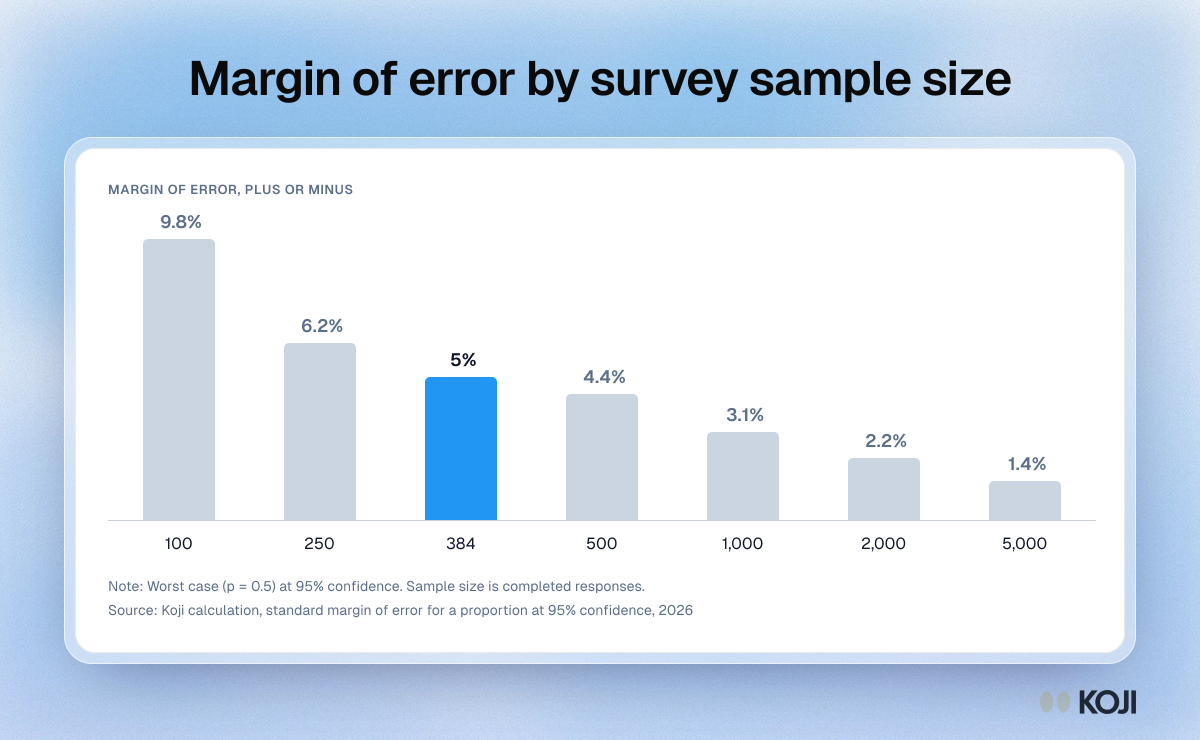
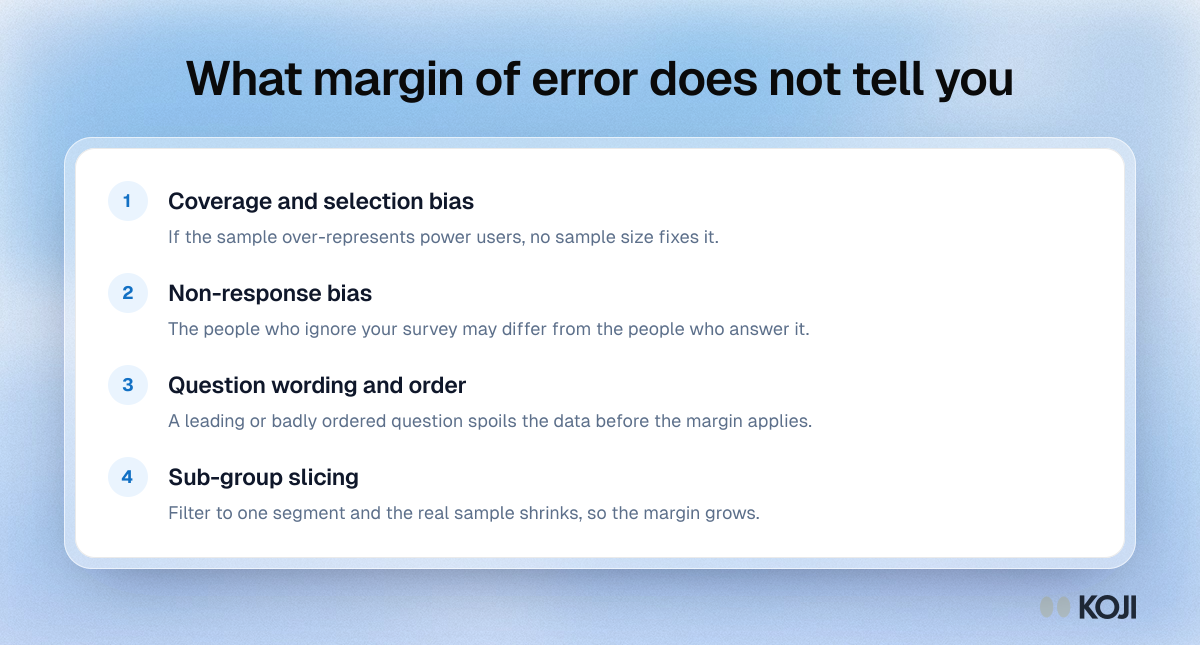
A column chart of the worst-case margin of error for a survey proportion at 95% confidence, for sample sizes from 100 to 5,000 completed responses. It shows why 384 responses is the usual target for a 5% margin and how quickly the gains shrink after 1,000. Values use the standard formula 1.96 times the square root of p(1 minus p) over n, with p = 0.5. Use it to pick a sample size before you launch, and remember it covers sampling noise only, not bias.
Where this appears
What's in this column chart
| Margin of error | |
|---|---|
| 100 | 9.8% |
| 250 | 6.2% |
| 384 | 5% |
| 500 | 4.4% |
| 1,000 | 3.1% |
| 2,000 | 2.2% |
| 5,000 | 1.4% |
Worst case (p = 0.5) at 95% confidence. Sample size is completed responses.
Use this image
Free to use in your docs, decks and posts under CC BY 4.0, as long as you credit Koji with a link to this page. To embed it, paste this into your page:
html
<a href="https://www.koji.so/visuals/survey-margin-of-error-by-sample-size-chart"><img src="https://www.koji.so/visuals/survey-margin-of-error-by-sample-size-chart/survey-margin-of-error-by-sample-size-chart.png" alt="Column chart of survey margin of error by sample size at 95% confidence: 9.8% at 100 responses, 5% at 384, 3.1% at 1,000 and 1.4% at 5,000." width="1200" height="740" /></a>
<p>Source: <a href="https://www.koji.so/visuals/survey-margin-of-error-by-sample-size-chart">Margin of error by survey sample size</a>, Koji</p>