Column chart
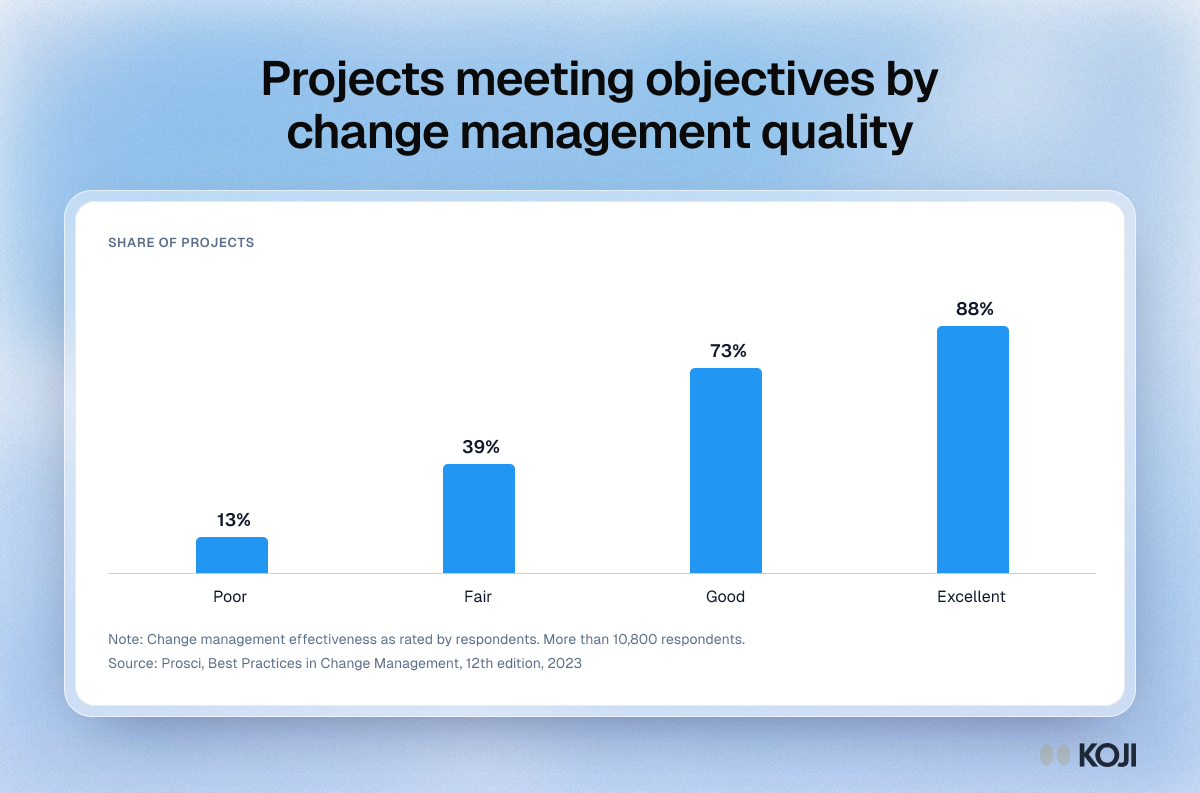
Projects meeting objectives by change management quality
How often projects met or beat their objectives at each level of change management effectiveness
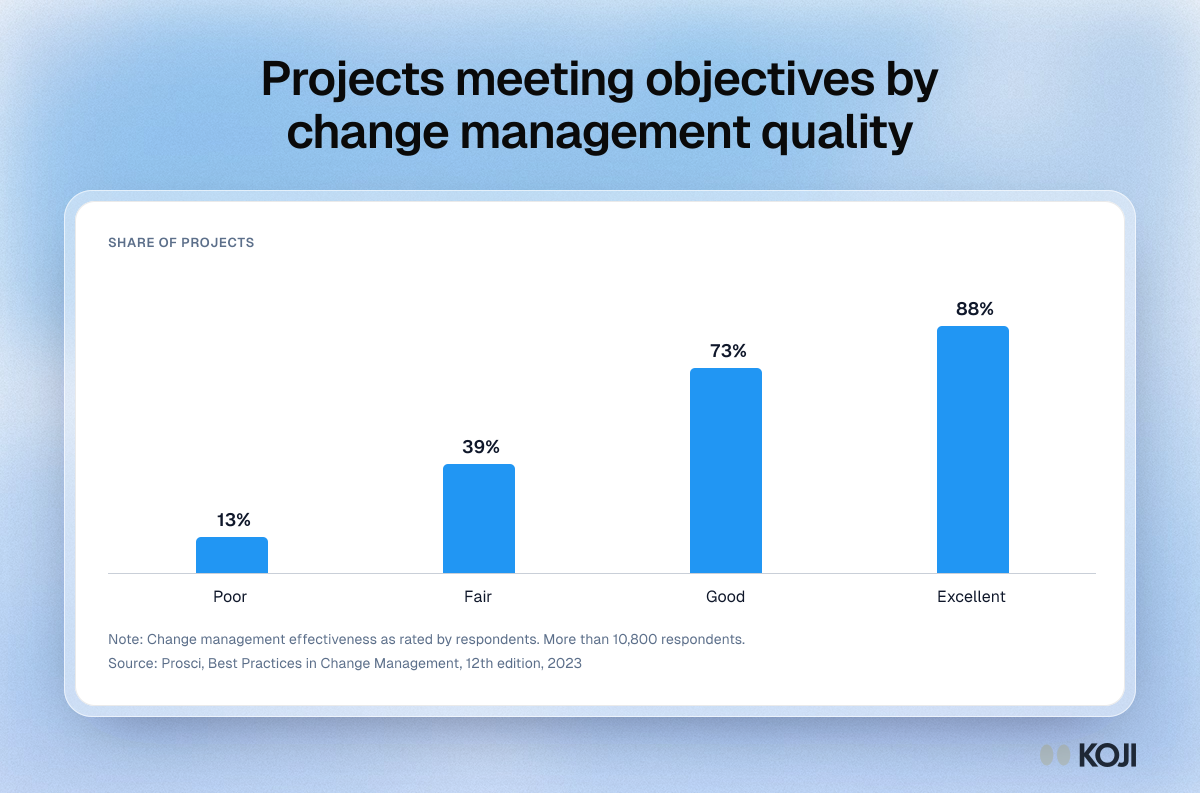
A column chart of Prosci's benchmark: 13% of projects with poor change management met or exceeded their objectives, against 88% with excellent change management. Business analysts and project leads can use it to explain why a post-implementation review should ask end users how the change landed, not only whether the system was delivered. Koji runs those end-user interviews at scale in a week.
Where this appears
What's in this column chart
| Met or exceeded objectives | |
|---|---|
| Poor | 13% |
| Fair | 39% |
| Good | 73% |
| Excellent | 88% |
Change management effectiveness as rated by respondents. More than 10,800 respondents.
Use this image
Free to use in your docs, decks and posts under CC BY 4.0, as long as you credit Koji with a link to this page. To embed it, paste this into your page:
html
<a href="https://www.koji.so/visuals/change-management-effectiveness-project-objectives-chart"><img src="https://www.koji.so/visuals/change-management-effectiveness-project-objectives-chart/change-management-effectiveness-project-objectives-chart.png" alt="Column chart of the share of projects meeting or exceeding objectives by change management effectiveness: poor 13%, fair 39%, good 73%, excellent 88%." width="1200" height="793" /></a>
<p>Source: <a href="https://www.koji.so/visuals/change-management-effectiveness-project-objectives-chart">Projects meeting objectives by change management quality</a>, Koji</p>