Column chart
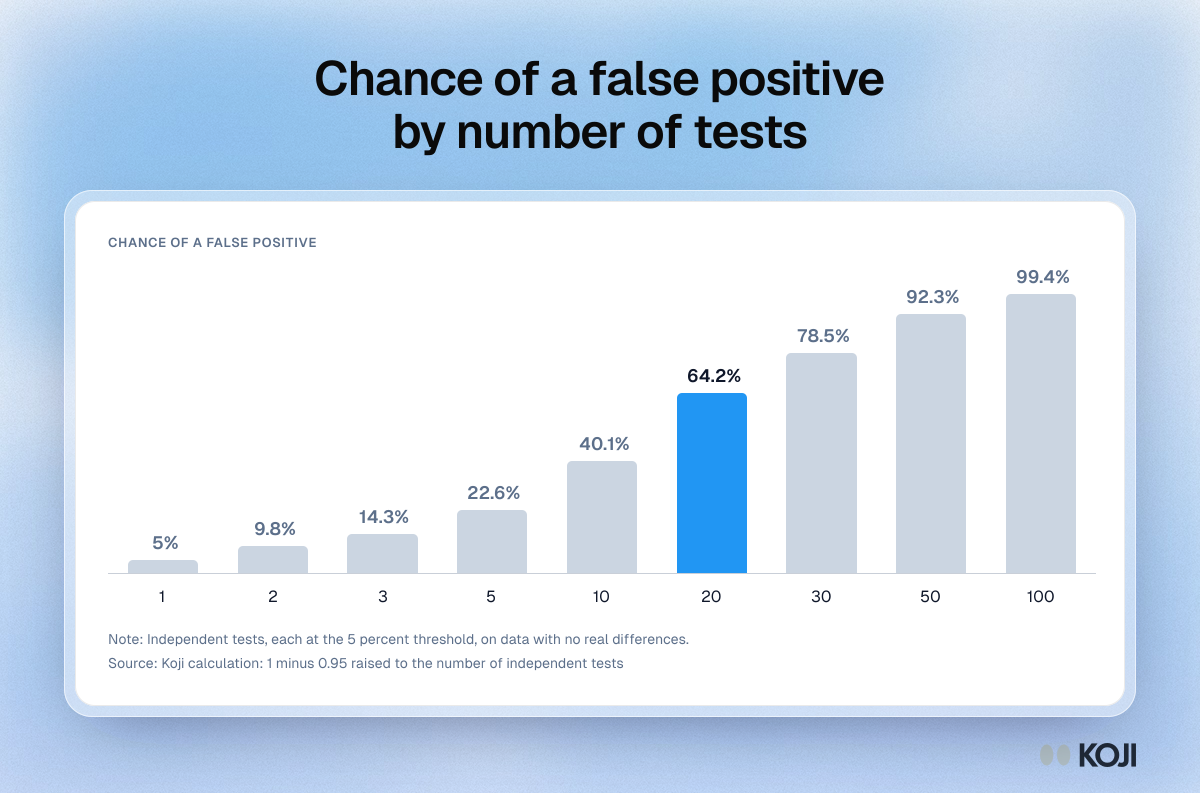
Chance of a false positive by number of tests
Why twenty segment cuts at p < 0.05 will usually turn up something
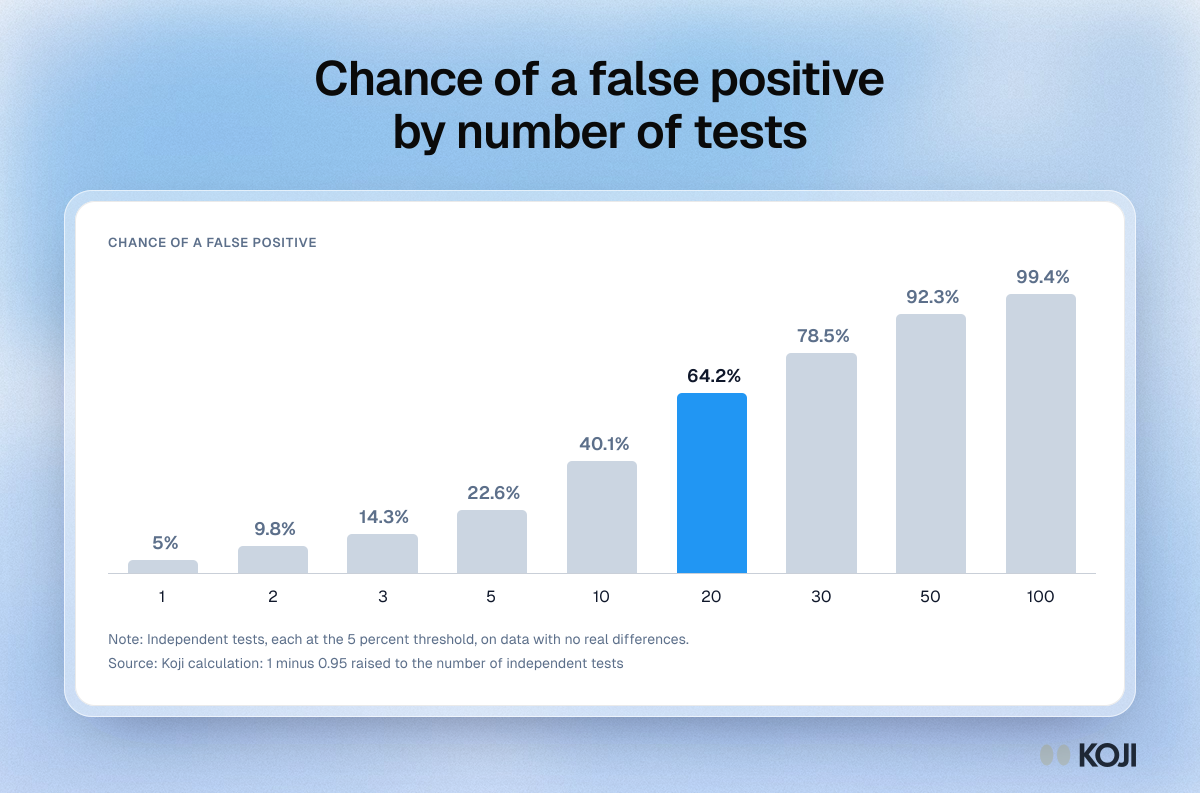
How the chance of at least one false positive grows with the number of independent significance tests, each judged at the 5 percent threshold on data with no real differences: 5 percent for one test, 40.1 percent for ten, 64.2 percent for twenty and 99.4 percent for a hundred. Use it to explain why segment sweeps and banner cuts need a correction such as Bonferroni, Holm or Benjamini-Hochberg, and why the number of tests should be declared before the analysis.
Where this appears
What's in this column chart
| At least one false positive | |
|---|---|
| 1 | 5% |
| 2 | 9.8% |
| 3 | 14.3% |
| 5 | 22.6% |
| 10 | 40.1% |
| 20 | 64.2% |
| 30 | 78.5% |
| 50 | 92.3% |
| 100 | 99.4% |
Independent tests, each at the 5 percent threshold, on data with no real differences.
Use this image
Free to use in your docs, decks and posts under CC BY 4.0, as long as you credit Koji with a link to this page. To embed it, paste this into your page:
<a href="https://www.koji.so/visuals/multiple-comparisons-false-positive-chance-by-number-of-tests"><img src="https://www.koji.so/visuals/multiple-comparisons-false-positive-chance-by-number-of-tests/multiple-comparisons-false-positive-chance-by-number-of-tests.png" alt="Column chart of the chance of at least one false positive at the 5 percent threshold: 5% for one test, 64.2% for 20 tests and 99.4% for 100 tests" width="1200" height="793" /></a>
<p>Source: <a href="https://www.koji.so/visuals/multiple-comparisons-false-positive-chance-by-number-of-tests">Chance of a false positive by number of tests</a>, Koji</p>