Column chart
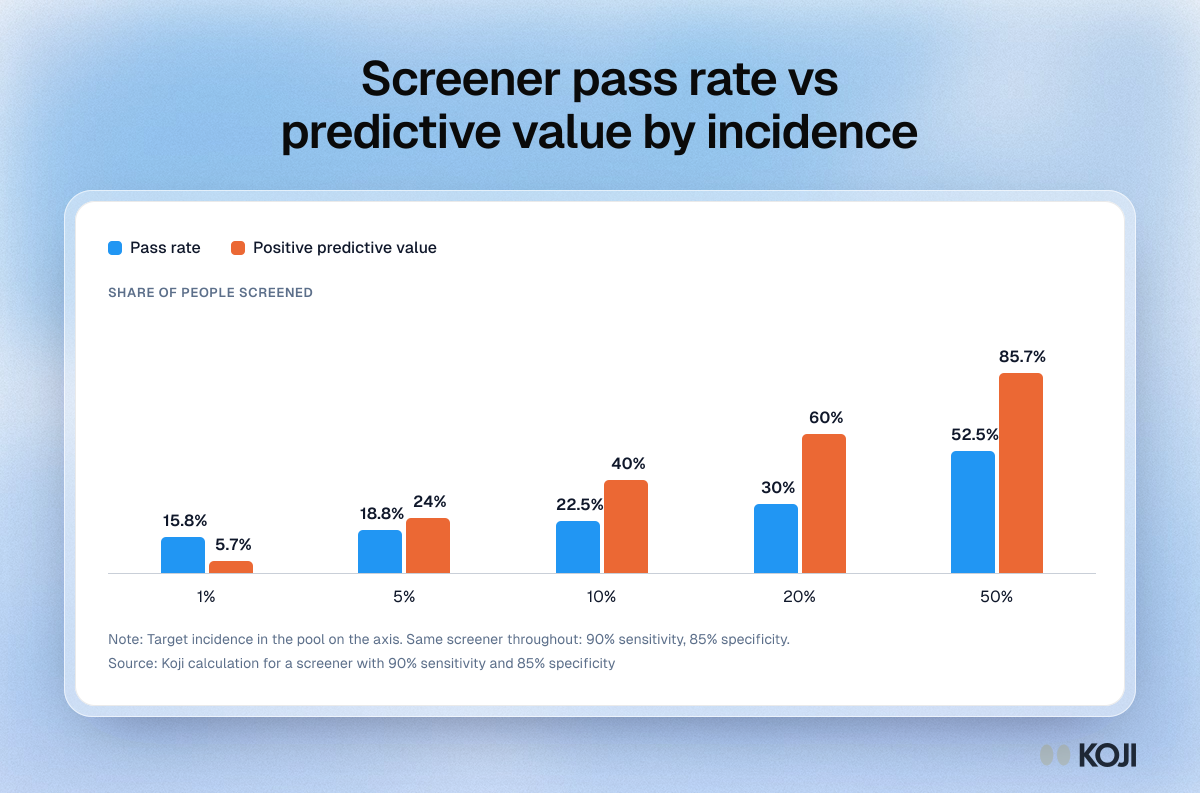
Screener pass rate vs predictive value by incidence
The pass rate barely moves while the share of right people who pass moves fifteenfold
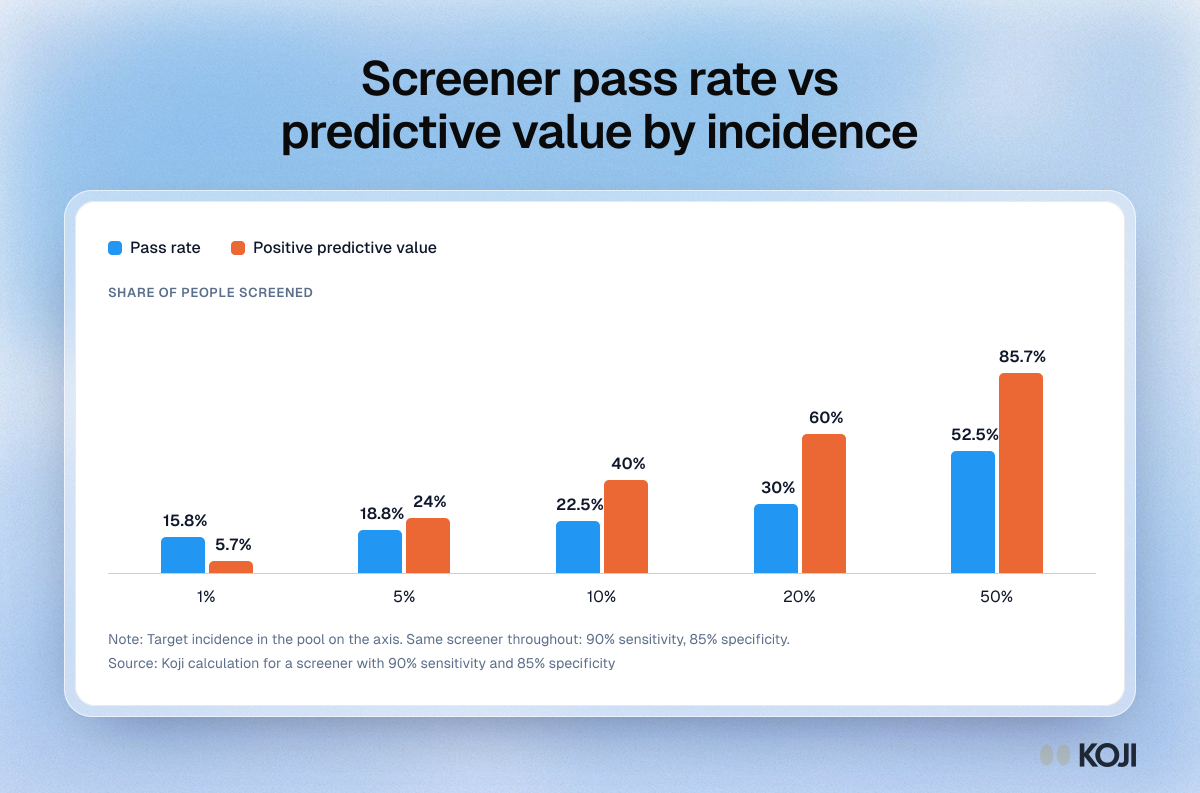
How target incidence in the pool changes a screener's results when the screener itself stays the same, at 90 percent sensitivity and 85 percent specificity. The pass rate only rises from 15.8 to 52.5 percent across the range, while positive predictive value, the share of people who pass and really are your target, climbs from 5.7 to 85.7 percent. Use it to explain why a healthy pass rate says nothing about sample quality, and why screening a better pool beats rewriting questions.
Where this appears
What's in this column chart
| Pass rate | Positive predictive value | |
|---|---|---|
| 1% | 15.8% | 5.7% |
| 5% | 18.8% | 24% |
| 10% | 22.5% | 40% |
| 20% | 30% | 60% |
| 50% | 52.5% | 85.7% |
Target incidence in the pool on the axis. Same screener throughout: 90% sensitivity, 85% specificity.
Use this image
Free to use in your docs, decks and posts under CC BY 4.0, as long as you credit Koji with a link to this page. To embed it, paste this into your page:
<a href="https://www.koji.so/visuals/screener-pass-rate-vs-positive-predictive-value-by-incidence"><img src="https://www.koji.so/visuals/screener-pass-rate-vs-positive-predictive-value-by-incidence/screener-pass-rate-vs-positive-predictive-value-by-incidence.png" alt="Column chart of a screener at 90% sensitivity and 85% specificity: as target incidence rises from 1% to 50%, predictive value climbs from 5.7% to 85.7%" width="1200" height="793" /></a>
<p>Source: <a href="https://www.koji.so/visuals/screener-pass-rate-vs-positive-predictive-value-by-incidence">Screener pass rate vs predictive value by incidence</a>, Koji</p>