Reference table
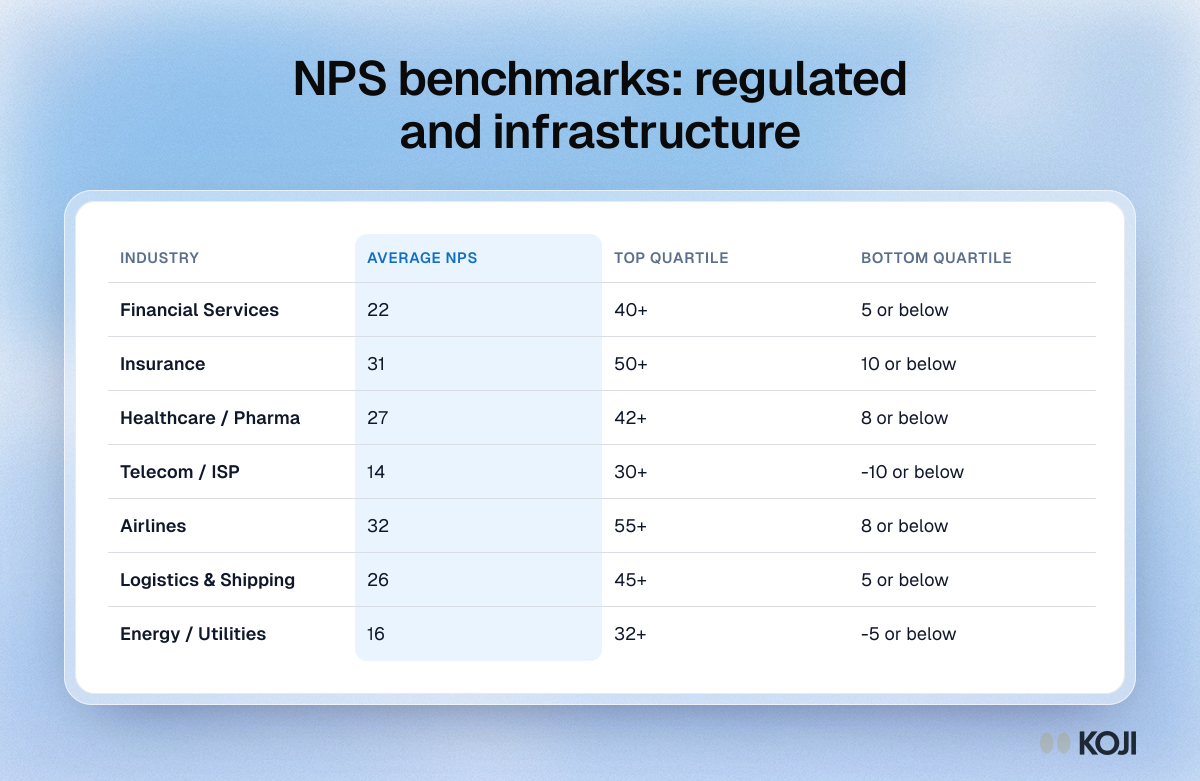
NPS benchmarks: regulated and infrastructure
Average, top quartile and bottom quartile Net Promoter Score for seven industries
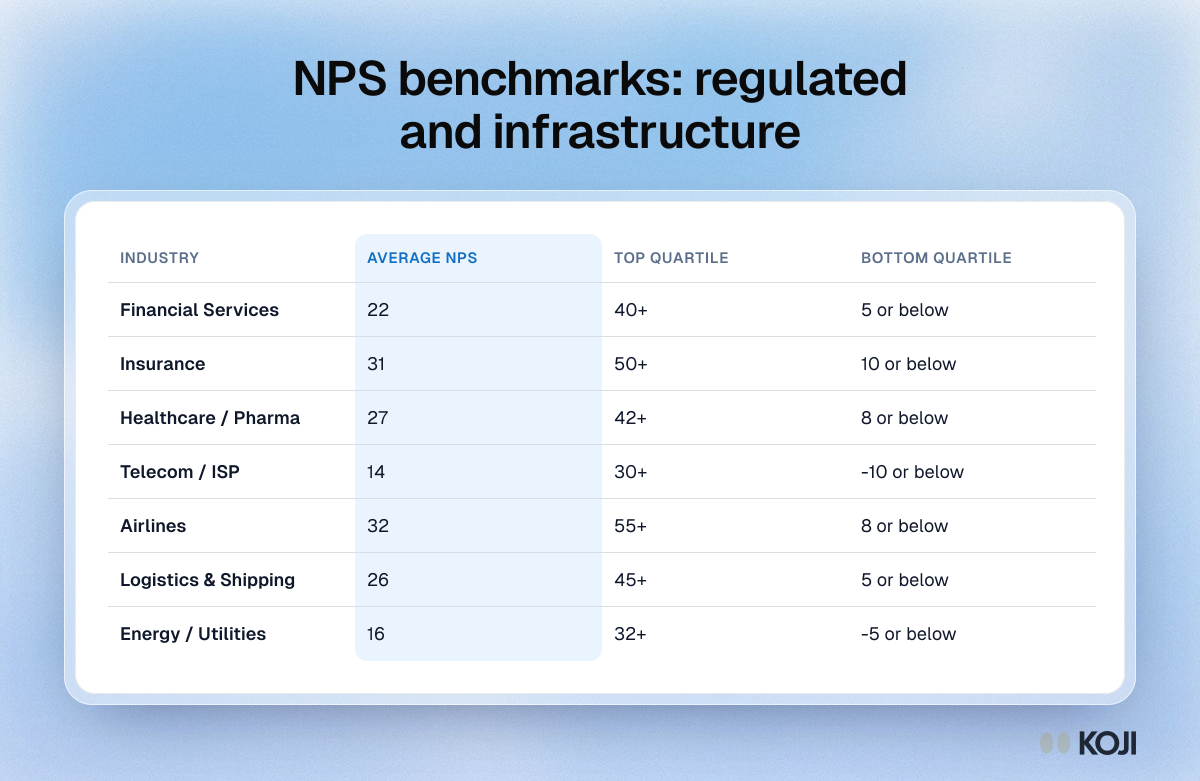
Average Net Promoter Score with top and bottom quartile cut-offs for financial services, insurance, healthcare, telecom, airlines, logistics and energy. These regulated and infrastructure sectors tend to score lower than high-touch services, so breaking 30 is a strong result. The figures are aggregated from published benchmark studies covering 2024 to 2026. Use it to set a realistic target for your own sector.
Where this appears
What's in this reference table
| Industry | Average NPS | Top quartile | Bottom quartile |
|---|---|---|---|
| Financial Services | 22 | 40+ | 5 or below |
| Insurance | 31 | 50+ | 10 or below |
| Healthcare / Pharma | 27 | 42+ | 8 or below |
| Telecom / ISP | 14 | 30+ | -10 or below |
| Airlines | 32 | 55+ | 8 or below |
| Logistics & Shipping | 26 | 45+ | 5 or below |
| Energy / Utilities | 16 | 32+ | -5 or below |
Use this image
Free to use in your docs, decks and posts under CC BY 4.0, as long as you credit Koji with a link to this page. To embed it, paste this into your page:
html
<a href="https://www.koji.so/visuals/nps-benchmarks-regulated-and-infrastructure-industries"><img src="https://www.koji.so/visuals/nps-benchmarks-regulated-and-infrastructure-industries/nps-benchmarks-regulated-and-infrastructure-industries.png" alt="Table of 2026 NPS benchmarks for seven regulated industries, including finance, insurance, healthcare and telecom, with quartile cut-offs." width="1200" height="781" /></a>
<p>Source: <a href="https://www.koji.so/visuals/nps-benchmarks-regulated-and-infrastructure-industries">NPS benchmarks: regulated and infrastructure</a>, Koji</p>