Bar chart
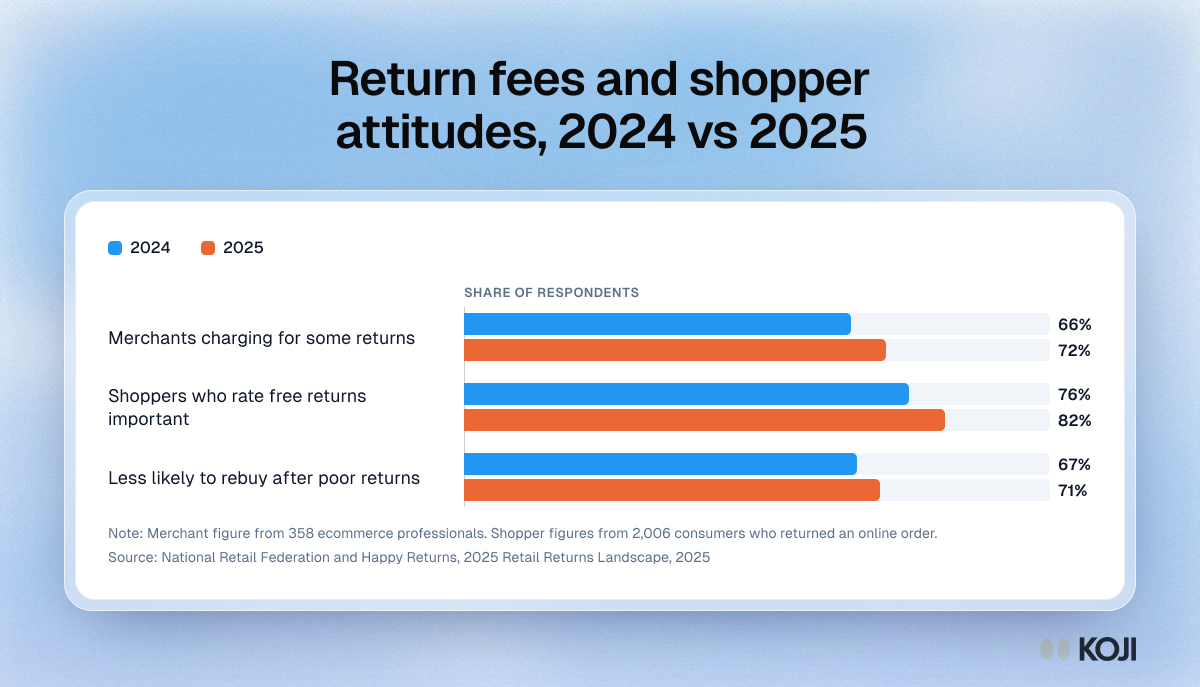
Return fees and shopper attitudes, 2024 vs 2025
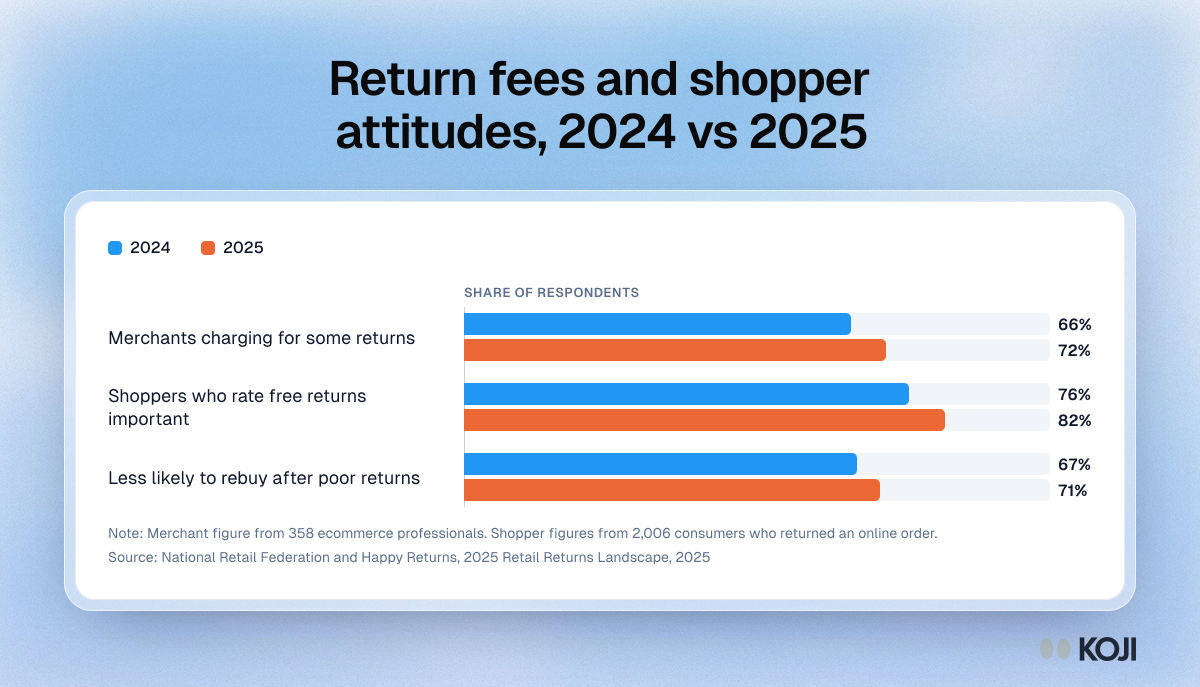
A bar chart of three figures from the National Retail Federation and Happy Returns 2025 Retail Returns Landscape, each compared with the year before: the share of US merchants charging for at least some return options (66% to 72%), shoppers who call free returns an important purchase factor (76% to 82%) and shoppers less likely to buy again after a poor returns experience (67% to 71%). Useful for ecommerce and CX teams weighing a returns fee. Koji helps you interview the customers who kept an item without a word.
Where this appears
What's in this bar chart
| 2024 | 2025 | |
|---|---|---|
| Merchants charging for some returns | 66% | 72% |
| Shoppers who rate free returns important | 76% | 82% |
| Less likely to rebuy after poor returns | 67% | 71% |
Merchant figure from 358 ecommerce professionals. Shopper figures from 2,006 consumers who returned an online order.
Use this image
Free to use in your docs, decks and posts under CC BY 4.0, as long as you credit Koji with a link to this page. To embed it, paste this into your page:
<a href="https://www.koji.so/visuals/nrf-return-fees-shopper-attitudes-2024-vs-2025"><img src="https://www.koji.so/visuals/nrf-return-fees-shopper-attitudes-2024-vs-2025/nrf-return-fees-shopper-attitudes-2024-vs-2025.png" alt="Bar chart of NRF returns data: merchants charging for some returns rose from 66% to 72%, and 82% of shoppers now call free returns important." width="1200" height="687" /></a>
<p>Source: <a href="https://www.koji.so/visuals/nrf-return-fees-shopper-attitudes-2024-vs-2025">Return fees and shopper attitudes, 2024 vs 2025</a>, Koji</p>