Bar chart
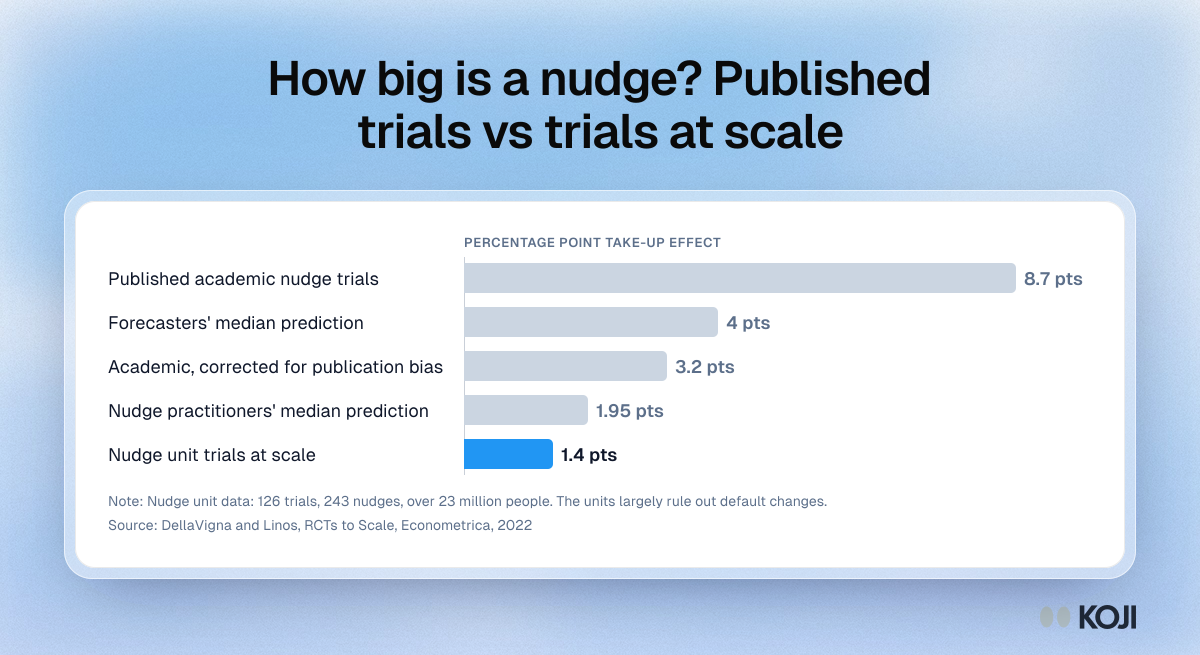
How big is a nudge? Published trials vs trials at scale
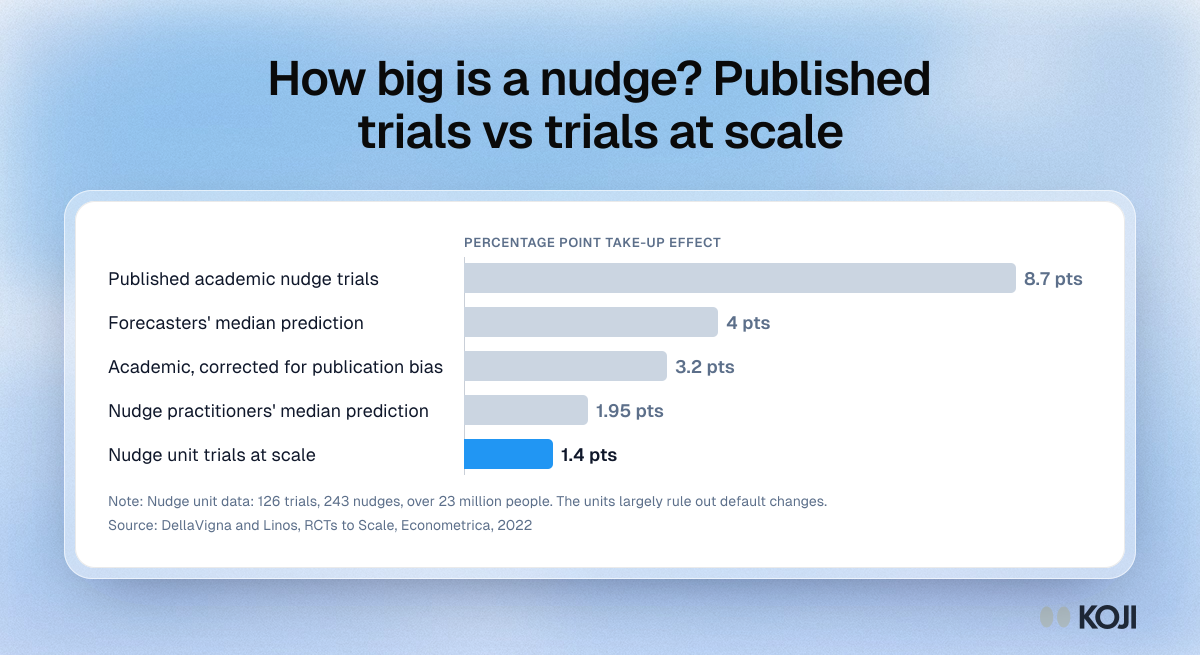
Average take-up effects of nudges from DellaVigna and Linos (Econometrica, 2022): 8.7 percentage points in published academic trials, 3.2 after correcting for selective publication, and 1.4 in 126 trials run by two US nudge units with over 23 million people. Forecasts sat in between. Use it to discount uplift figures quoted in case studies and vendor decks.
Where this appears
What's in this bar chart
| Average take-up effect | |
|---|---|
| Published academic nudge trials | 8.7 pts |
| Forecasters' median prediction | 4 pts |
| Academic, corrected for publication bias | 3.2 pts |
| Nudge practitioners' median prediction | 1.95 pts |
| Nudge unit trials at scale | 1.4 pts |
Nudge unit data: 126 trials, 243 nudges, over 23 million people. The units largely rule out default changes.
Use this image
Free to use in your docs, decks and posts under CC BY 4.0, as long as you credit Koji with a link to this page. To embed it, paste this into your page:
html
<a href="https://www.koji.so/visuals/nudge-effect-sizes-academic-vs-at-scale"><img src="https://www.koji.so/visuals/nudge-effect-sizes-academic-vs-at-scale/nudge-effect-sizes-academic-vs-at-scale.png" alt="Bar chart of nudge effect sizes: 8.7 points in published academic trials against 1.4 points in 126 nudge unit trials run at scale." width="1200" height="655" /></a>
<p>Source: <a href="https://www.koji.so/visuals/nudge-effect-sizes-academic-vs-at-scale">How big is a nudge? Published trials vs trials at scale</a>, Koji</p>