Reference table
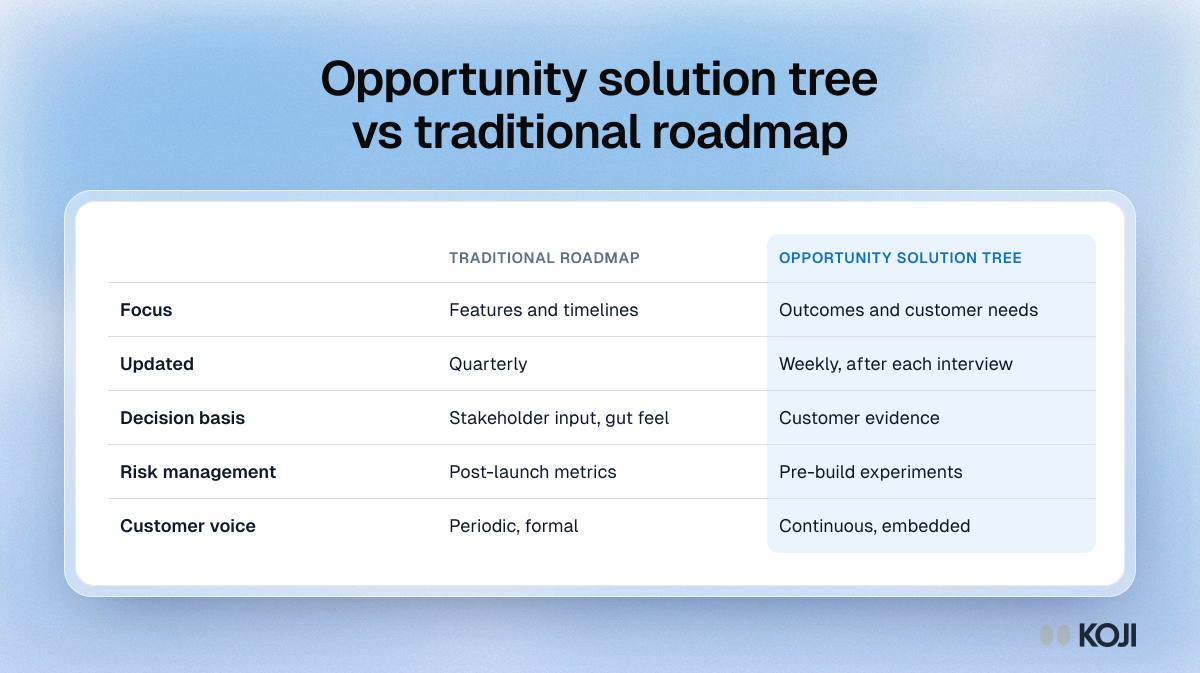
Opportunity solution tree vs traditional roadmap
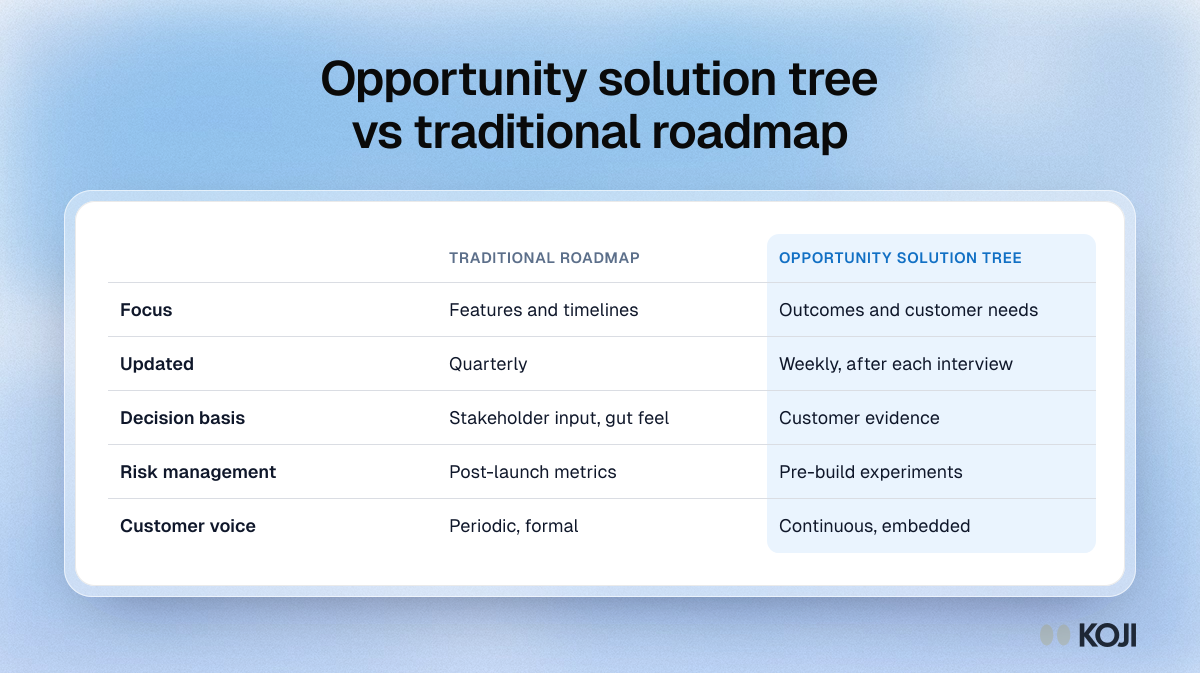
A comparison of a traditional product roadmap and an opportunity solution tree across five rows: what each focuses on, how often it changes, what decisions rest on, how risk is handled and how often customers are heard. Use it to explain to stakeholders why discovery runs on a tree while delivery still runs on a roadmap. Koji keeps the customer evidence side of the tree coming in every week.
Where this appears
What's in this reference table
| Traditional roadmap | Opportunity solution tree | |
|---|---|---|
| Focus | Features and timelines | Outcomes and customer needs |
| Updated | Quarterly | Weekly, after each interview |
| Decision basis | Stakeholder input, gut feel | Customer evidence |
| Risk management | Post-launch metrics | Pre-build experiments |
| Customer voice | Periodic, formal | Continuous, embedded |
Use this image
Free to use in your docs, decks and posts under CC BY 4.0, as long as you credit Koji with a link to this page. To embed it, paste this into your page:
html
<a href="https://www.koji.so/visuals/opportunity-solution-tree-vs-product-roadmap"><img src="https://www.koji.so/visuals/opportunity-solution-tree-vs-product-roadmap/opportunity-solution-tree-vs-product-roadmap.png" alt="Table comparing a traditional product roadmap with an opportunity solution tree on focus, update rhythm, decision basis, risk and customer voice." width="1200" height="673" /></a>
<p>Source: <a href="https://www.koji.so/visuals/opportunity-solution-tree-vs-product-roadmap">Opportunity solution tree vs traditional roadmap</a>, Koji</p>