Bar chart
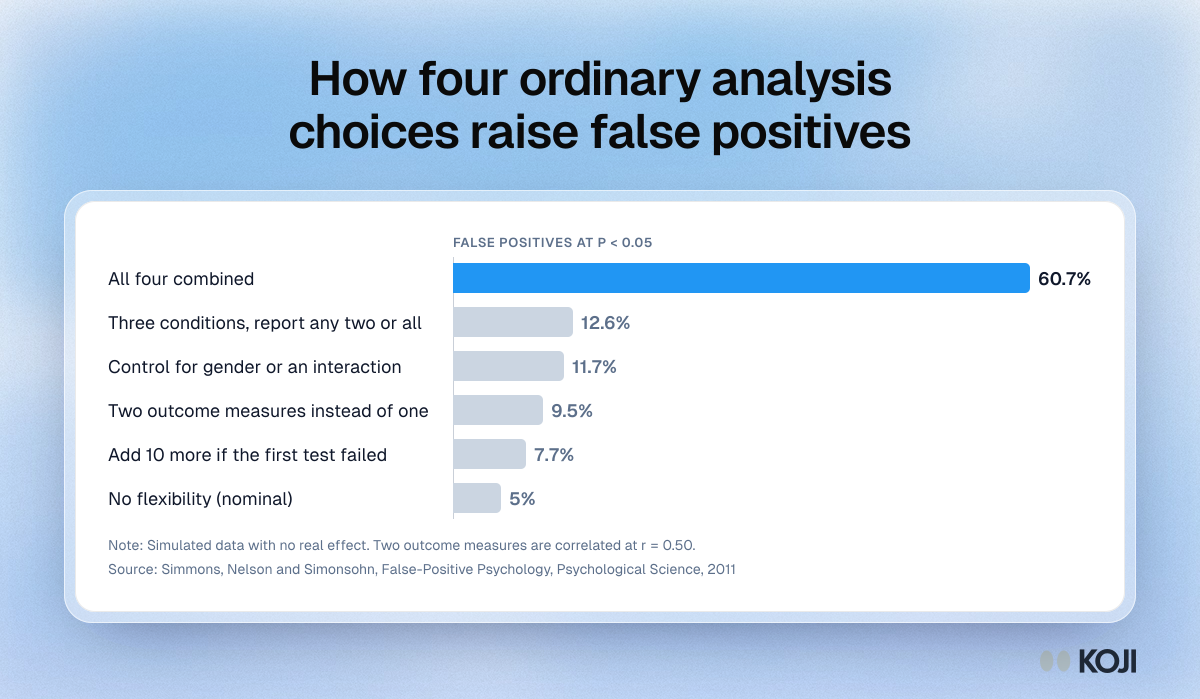
How four ordinary analysis choices raise false positives
Simulated false-positive rates when a researcher keeps a few common analytic freedoms
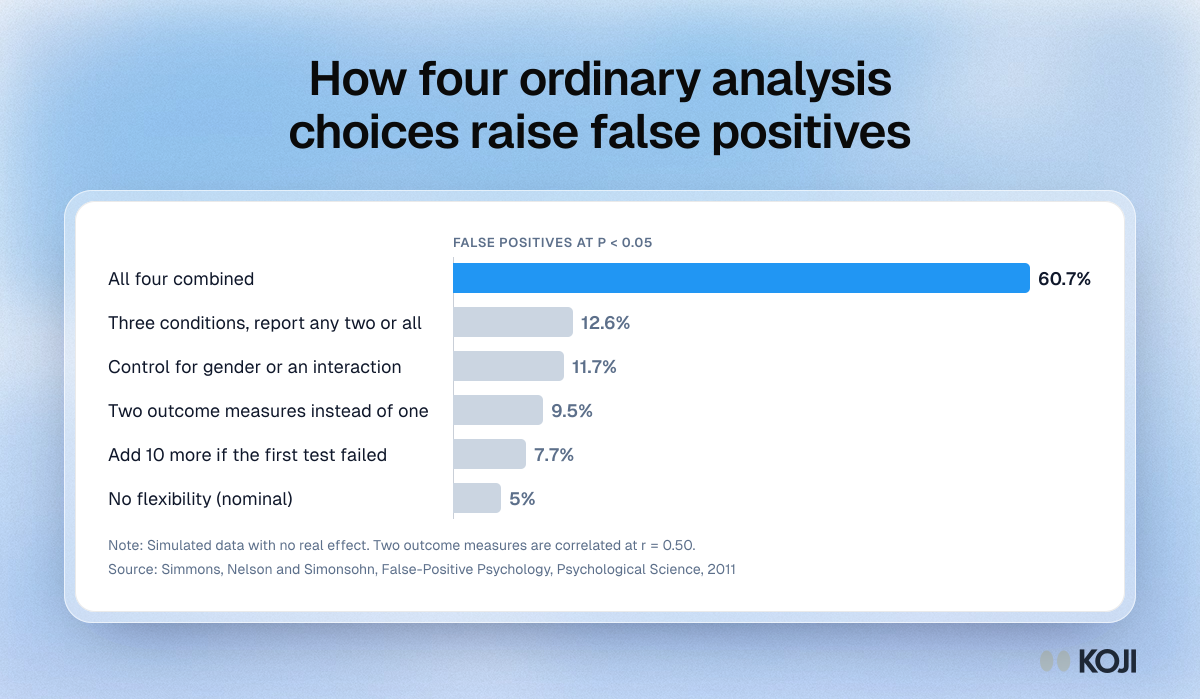
A bar chart of the false-positive rates Simmons, Nelson and Simonsohn found when they simulated four common analytic freedoms: a second outcome measure, ten extra observations, a gender control and a dropped condition. Each one alone lifts the rate a little above 5%. All four together reach 60.7%. Use it to explain why a study needs an analysis plan written before the data arrives. In Koji, the research brief is written and versioned before fielding, so it works as that plan.
Where this appears
What's in this bar chart
| False-positive rate | |
|---|---|
| All four combined | 60.7% |
| Three conditions, report any two or all | 12.6% |
| Control for gender or an interaction | 11.7% |
| Two outcome measures instead of one | 9.5% |
| Add 10 more if the first test failed | 7.7% |
| No flexibility (nominal) | 5% |
Simulated data with no real effect. Two outcome measures are correlated at r = 0.50.
Use this image
Free to use in your docs, decks and posts under CC BY 4.0, as long as you credit Koji with a link to this page. To embed it, paste this into your page:
<a href="https://www.koji.so/visuals/p-hacking-false-positive-rate-by-researcher-degree-of-freedom"><img src="https://www.koji.so/visuals/p-hacking-false-positive-rate-by-researcher-degree-of-freedom/p-hacking-false-positive-rate-by-researcher-degree-of-freedom.png" alt="Bar chart of simulated false-positive rates: 5% with no flexibility, 7.7% to 12.6% for each single choice, and 60.7% with all four combined." width="1200" height="699" /></a>
<p>Source: <a href="https://www.koji.so/visuals/p-hacking-false-positive-rate-by-researcher-degree-of-freedom">How four ordinary analysis choices raise false positives</a>, Koji</p>