Bar chart
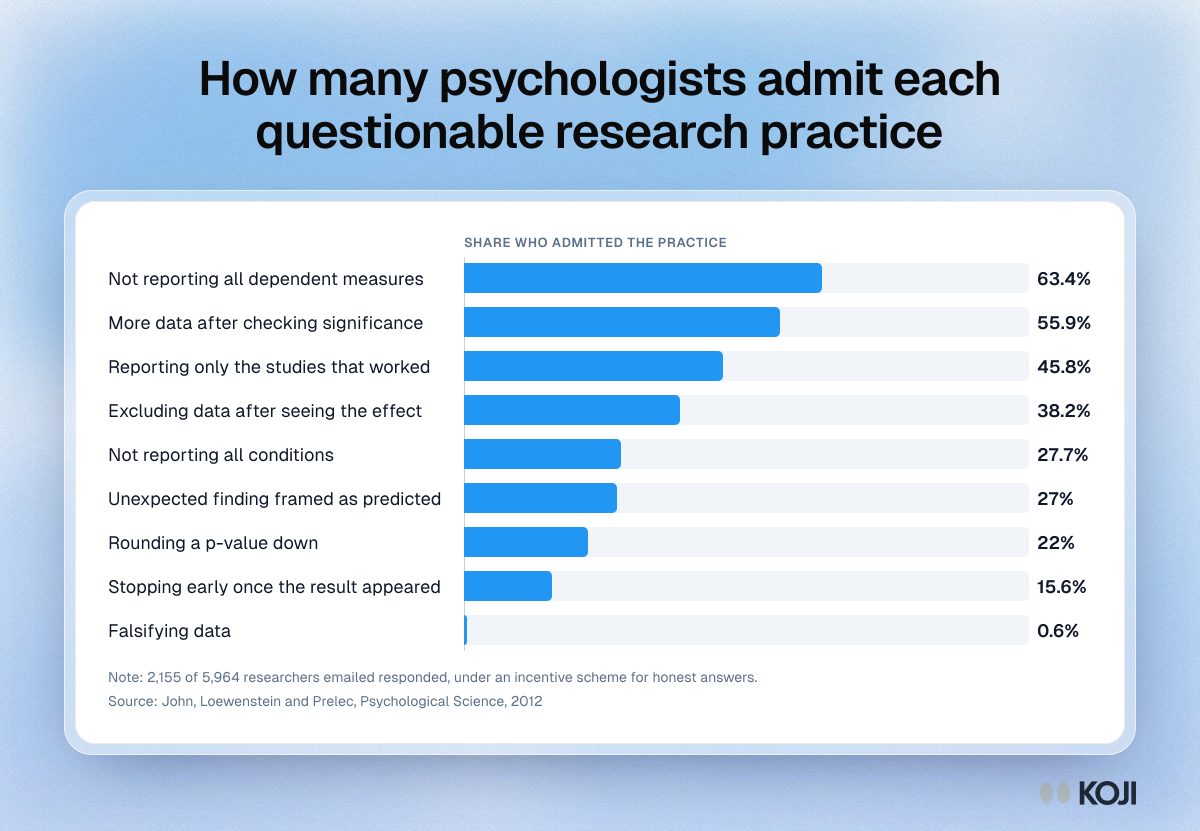
How many psychologists admit each questionable research practice
Self-admission rates from a survey of academic psychologists with incentives for truth telling
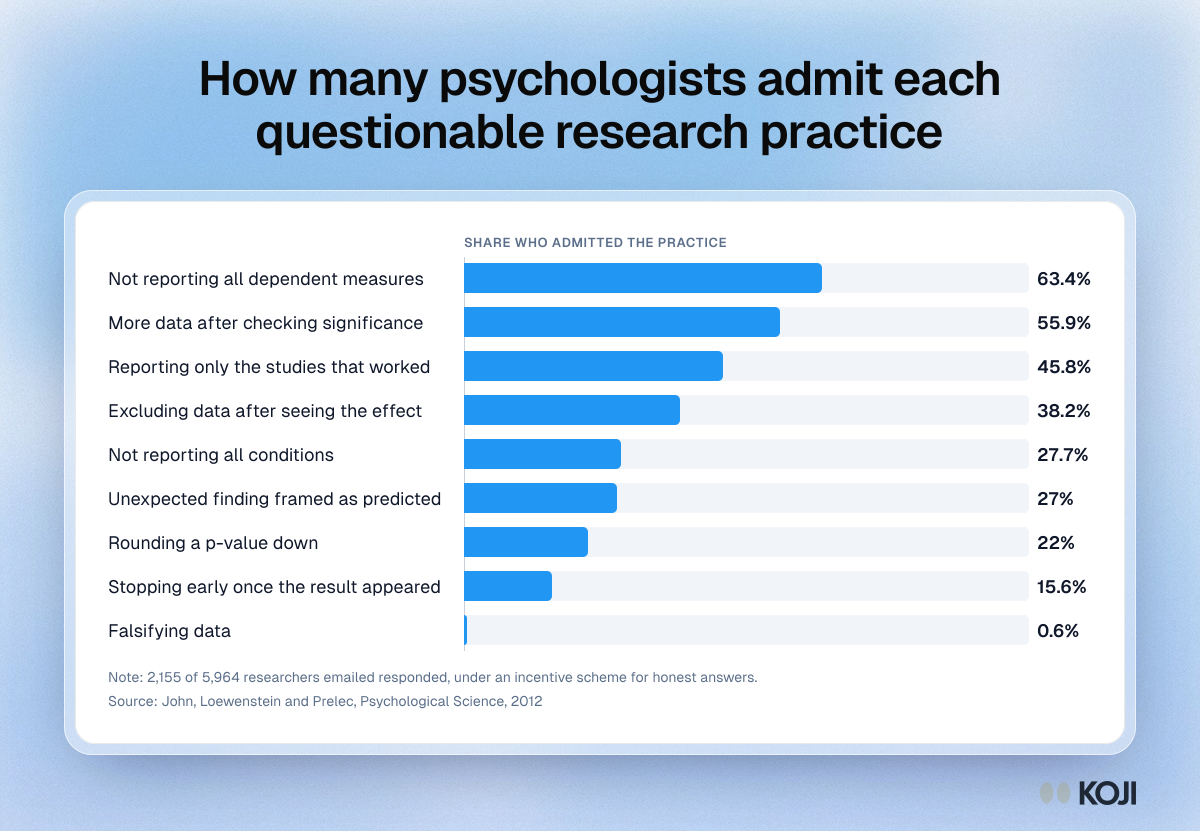
A bar chart of how often academic psychologists admitted nine questionable research practices in a 2012 survey by John, Loewenstein and Prelec. Selective reporting of measures and topping up data after a peek top the list, while falsifying data sits under 1%. It is useful for showing teams that p-hacking is mostly ordinary judgement made without a written plan, not misconduct. Koji helps by fixing the questions and measures in the brief before anyone is interviewed.
Where this appears
What's in this bar chart
| Admitted it | |
|---|---|
| Not reporting all dependent measures | 63.4% |
| More data after checking significance | 55.9% |
| Reporting only the studies that worked | 45.8% |
| Excluding data after seeing the effect | 38.2% |
| Not reporting all conditions | 27.7% |
| Unexpected finding framed as predicted | 27% |
| Rounding a p-value down | 22% |
| Stopping early once the result appeared | 15.6% |
| Falsifying data | 0.6% |
2,155 of 5,964 researchers emailed responded, under an incentive scheme for honest answers.
Use this image
Free to use in your docs, decks and posts under CC BY 4.0, as long as you credit Koji with a link to this page. To embed it, paste this into your page:
<a href="https://www.koji.so/visuals/questionable-research-practices-self-admission-rates"><img src="https://www.koji.so/visuals/questionable-research-practices-self-admission-rates/questionable-research-practices-self-admission-rates.png" alt="Bar chart of self-admitted research practices: 63.4% did not report all measures, 55.9% added data after checking results, 0.6% falsified data." width="1200" height="831" /></a>
<p>Source: <a href="https://www.koji.so/visuals/questionable-research-practices-self-admission-rates">How many psychologists admit each questionable research practice</a>, Koji</p>