Stacked bar chart
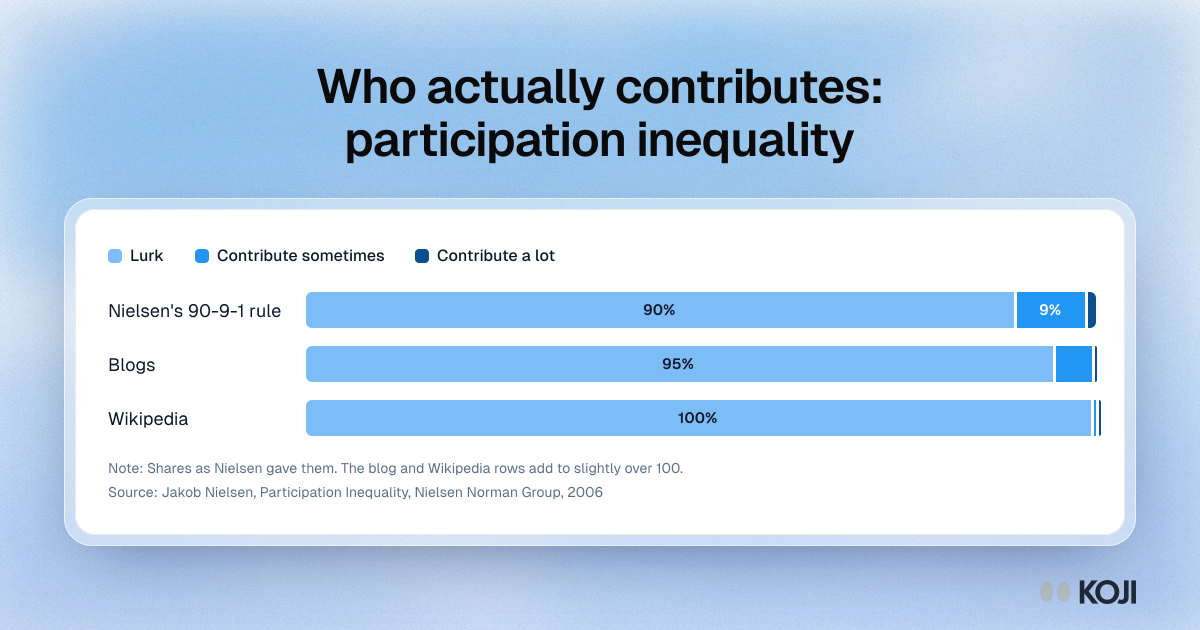
Who actually contributes: participation inequality
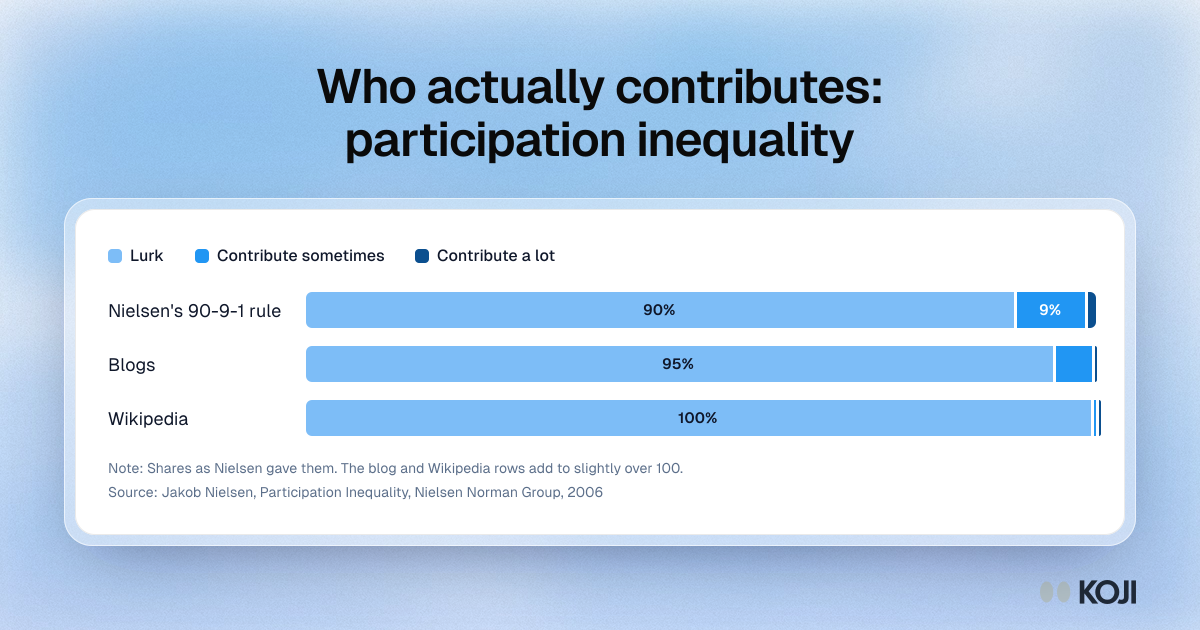
Jakob Nielsen's participation inequality figures, shown as the share of users who only read, contribute sometimes or contribute a lot. In a typical online community the split is 90, 9 and 1. On blogs it is closer to 95, 5 and 0.1, and on Wikipedia 99.8, 0.2 and 0.003. Teams reading in-product AI feedback should expect the same skew and sample the quiet majority on purpose.
Where this appears
What's in this stacked bar chart
| Lurk | Contribute sometimes | Contribute a lot | |
|---|---|---|---|
| Nielsen's 90-9-1 rule | 90% | 9% | 1% |
| Blogs | 95% | 5% | 0% |
| Wikipedia | 100% | 0% | 0% |
Shares as Nielsen gave them. The blog and Wikipedia rows add to slightly over 100.
Use this image
Free to use in your docs, decks and posts under CC BY 4.0, as long as you credit Koji with a link to this page. To embed it, paste this into your page:
html
<a href="https://www.koji.so/visuals/participation-inequality-90-9-1-chart"><img src="https://www.koji.so/visuals/participation-inequality-90-9-1-chart/participation-inequality-90-9-1-chart.png" alt="Stacked bar chart of participation inequality: 90% of users lurk, 9% contribute sometimes and 1% a lot, with blogs and Wikipedia even more skewed." width="1200" height="630" /></a>
<p>Source: <a href="https://www.koji.so/visuals/participation-inequality-90-9-1-chart">Who actually contributes: participation inequality</a>, Koji</p>