Stacked bar chart
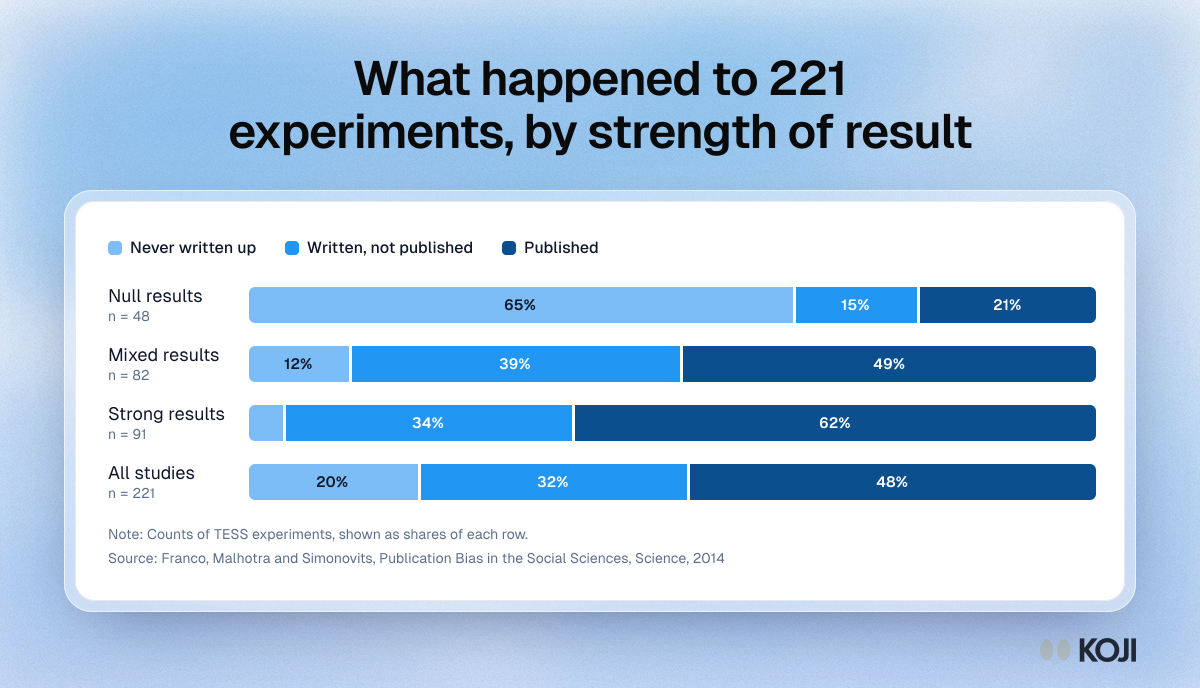
What happened to 221 experiments, by strength of result
Franco, Malhotra and Simonovits tracked every study in a known population, published or not
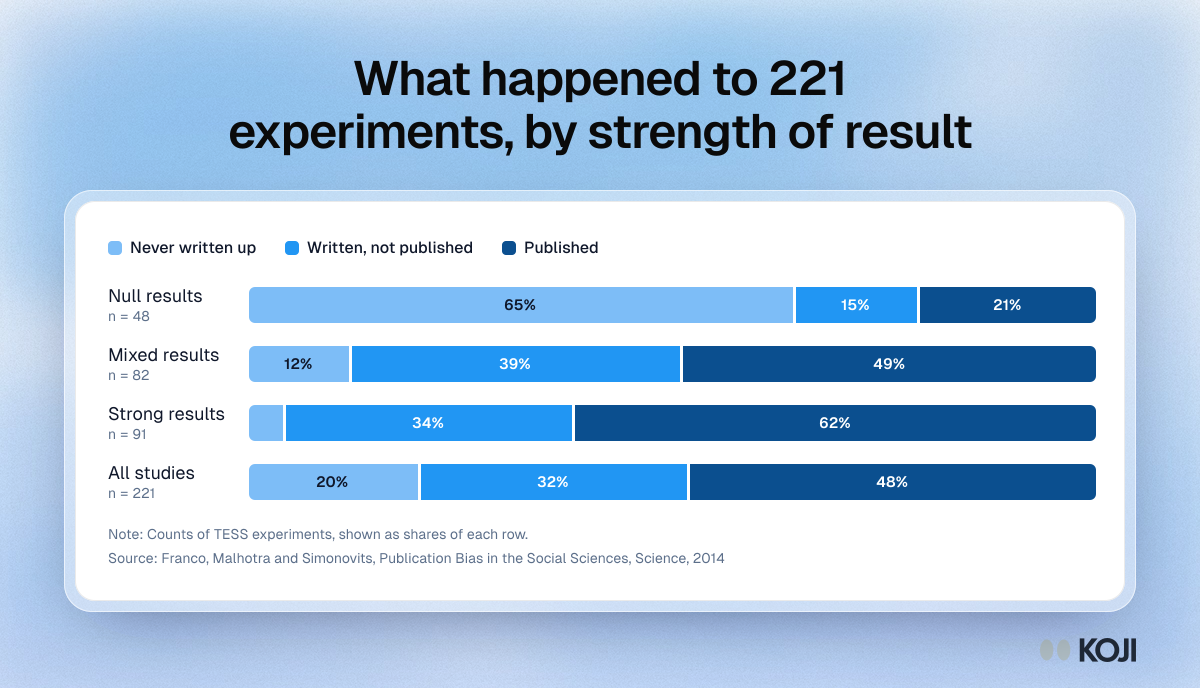
A stacked bar chart of what became of 221 social science experiments run through Time-sharing Experiments in the Social Sciences, split by how strong the result was. Most null studies were never written up, while most strong studies were published, and among studies that were written up the publication rates were close. Use it to show why an internal evidence base over-represents positive findings. Koji generates a report for every study as responses arrive, so flat results still leave a record.
Where this appears
What's in this stacked bar chart
| Never written up | Written, not published | Published | Responses | |
|---|---|---|---|---|
| Null results | 65% | 15% | 21% | 48 |
| Mixed results | 12% | 39% | 49% | 82 |
| Strong results | 4% | 34% | 62% | 91 |
| All studies | 20% | 32% | 48% | 221 |
Counts of TESS experiments, shown as shares of each row.
Use this image
Free to use in your docs, decks and posts under CC BY 4.0, as long as you credit Koji with a link to this page. To embed it, paste this into your page:
<a href="https://www.koji.so/visuals/file-drawer-what-happened-to-221-experiments-by-result"><img src="https://www.koji.so/visuals/file-drawer-what-happened-to-221-experiments-by-result/file-drawer-what-happened-to-221-experiments-by-result.png" alt="Stacked bar chart of 221 experiments: 31 of 48 null results were never written up, against 4 of 91 strong results, and 106 studies were published." width="1200" height="688" /></a>
<p>Source: <a href="https://www.koji.so/visuals/file-drawer-what-happened-to-221-experiments-by-result">What happened to 221 experiments, by strength of result</a>, Koji</p>