Bar chart
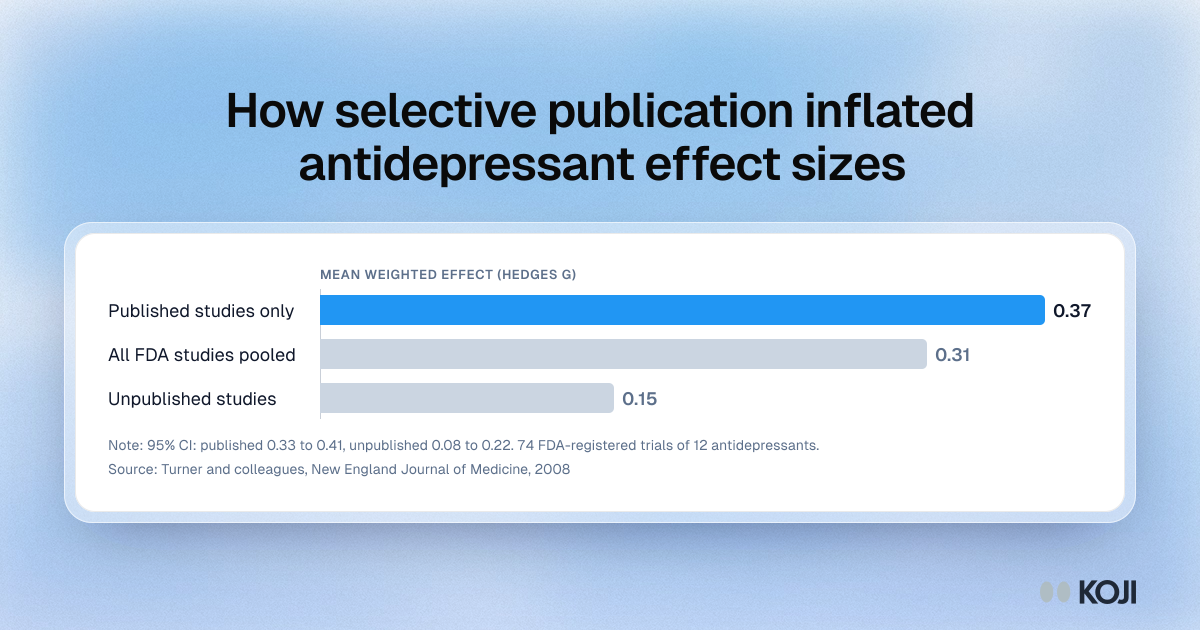
How selective publication inflated antidepressant effect sizes
Mean effect in the published record against the full set of FDA-registered trials
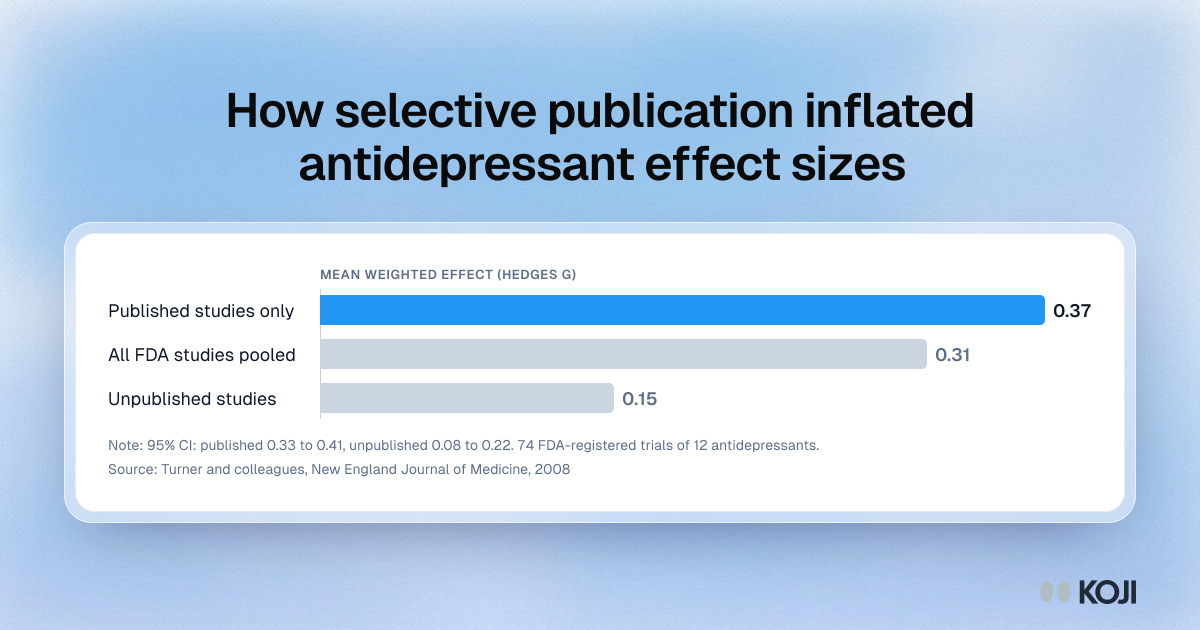
A bar chart from Turner and colleagues' comparison of 74 FDA-registered antidepressant trials with the published literature. Published studies alone showed a mean effect of 0.37, unpublished studies 0.15, and all FDA studies pooled 0.31, an overall inflation of 32 percent. Use it to explain why effect sizes quoted from an internal research archive are likely to be too large. Koji keeps a report for every study, including the flat ones, so the full record can be pooled.
Where this appears
What's in this bar chart
| Mean effect size | |
|---|---|
| Published studies only | 0.37 |
| All FDA studies pooled | 0.31 |
| Unpublished studies | 0.15 |
95% CI: published 0.33 to 0.41, unpublished 0.08 to 0.22. 74 FDA-registered trials of 12 antidepressants.
Use this image
Free to use in your docs, decks and posts under CC BY 4.0, as long as you credit Koji with a link to this page. To embed it, paste this into your page:
<a href="https://www.koji.so/visuals/publication-bias-effect-size-inflation-antidepressant-trials"><img src="https://www.koji.so/visuals/publication-bias-effect-size-inflation-antidepressant-trials/publication-bias-effect-size-inflation-antidepressant-trials.png" alt="Bar chart of antidepressant trial effect sizes: 0.37 in published studies, 0.31 across all FDA studies and 0.15 in unpublished studies." width="1200" height="630" /></a>
<p>Source: <a href="https://www.koji.so/visuals/publication-bias-effect-size-inflation-antidepressant-trials">How selective publication inflated antidepressant effect sizes</a>, Koji</p>