Column chart
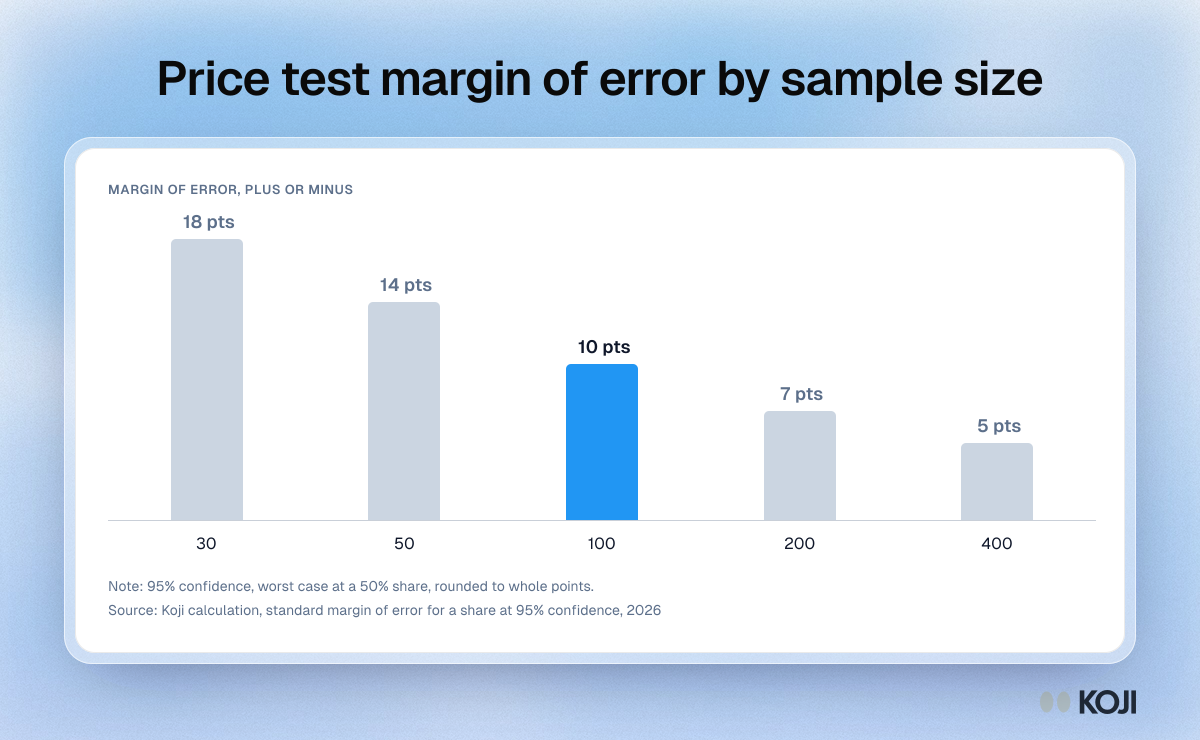
Price test margin of error by sample size
How wide the error is on the share who would buy, from 30 to 400 answers
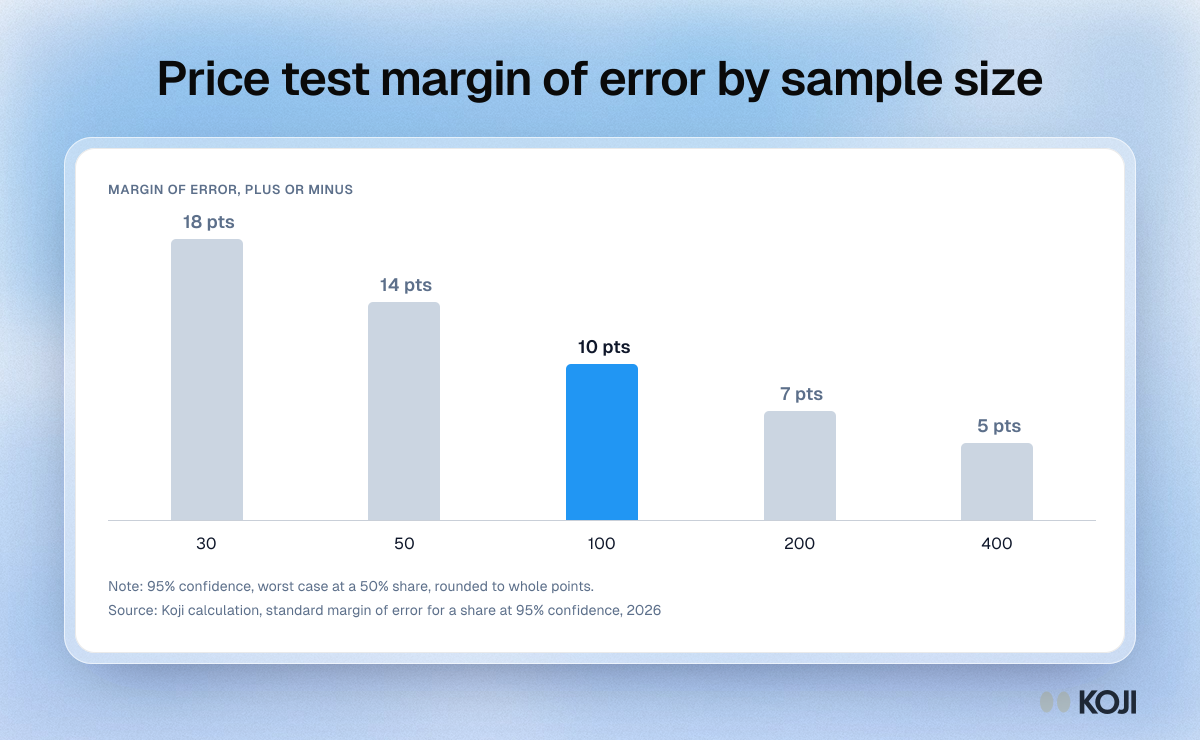
How precise a Gabor-Granger price test is at each sample size, shown as the 95 percent margin of error on the share who would buy at a price. It uses the worst case, a 50 percent share, so it is the safe figure to plan with. At 30 answers the error is about 18 points, enough for two neighbouring prices to swap places. At 100 it is about 10. Use it to decide whether you need a direction or a number you can quote before you field a price test in Koji.
What's in this column chart
| Margin of error | |
|---|---|
| 30 | 18 pts |
| 50 | 14 pts |
| 100 | 10 pts |
| 200 | 7 pts |
| 400 | 5 pts |
95% confidence, worst case at a 50% share, rounded to whole points.
Use this image
Free to use in your docs, decks and posts under CC BY 4.0, as long as you credit Koji with a link to this page. To embed it, paste this into your page:
<a href="https://www.koji.so/visuals/price-test-margin-of-error-by-sample-size"><img src="https://www.koji.so/visuals/price-test-margin-of-error-by-sample-size/price-test-margin-of-error-by-sample-size.png" alt="Column chart of the 95 percent margin of error at a 50 percent share: 18 points at 30 answers, 14 at 50, 10 at 100, 7 at 200 and 5 at 400" width="1200" height="740" /></a>
<p>Source: <a href="https://www.koji.so/visuals/price-test-margin-of-error-by-sample-size">Price test margin of error by sample size</a>, Koji</p>