Column chart
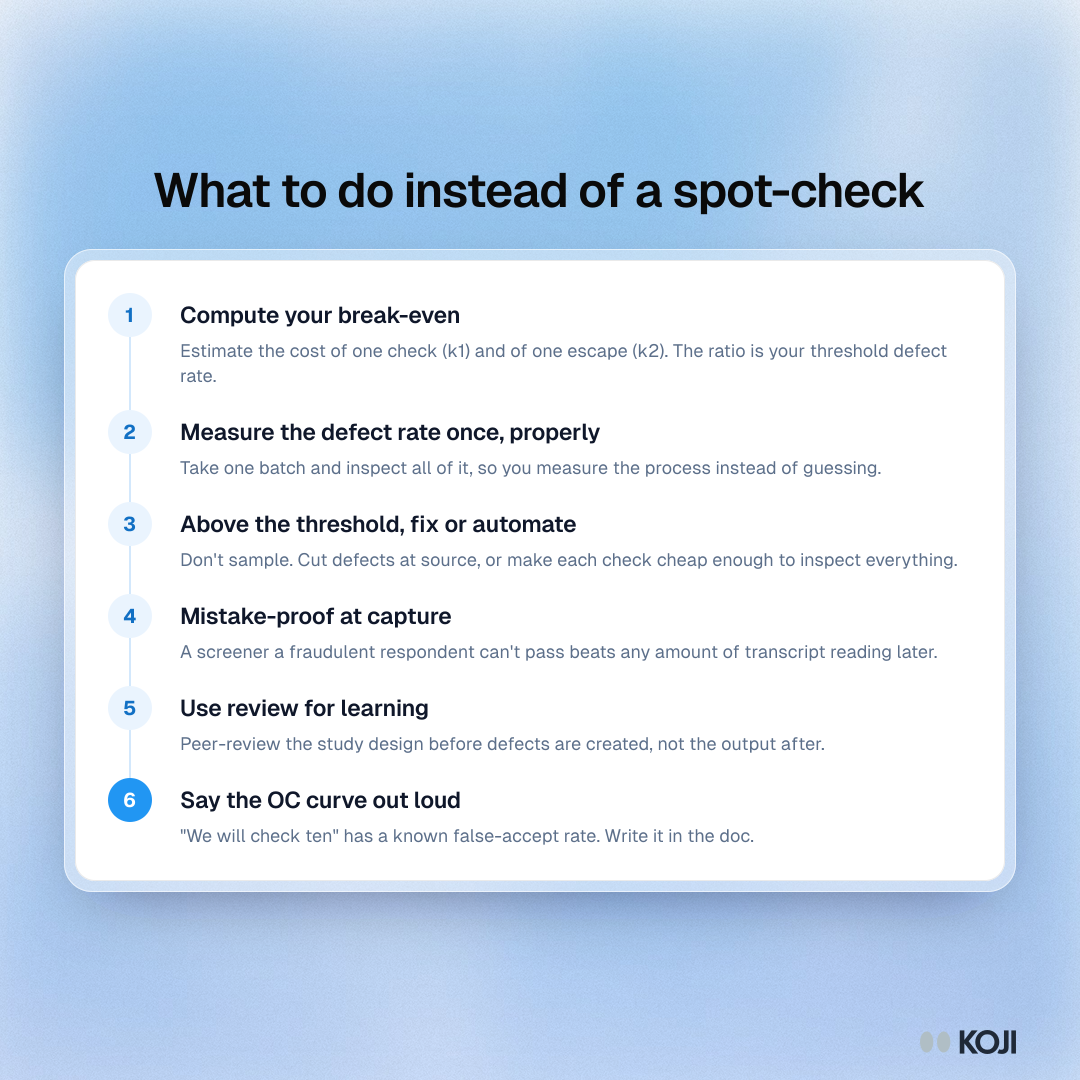
How often a 10-item spot-check passes a bad batch
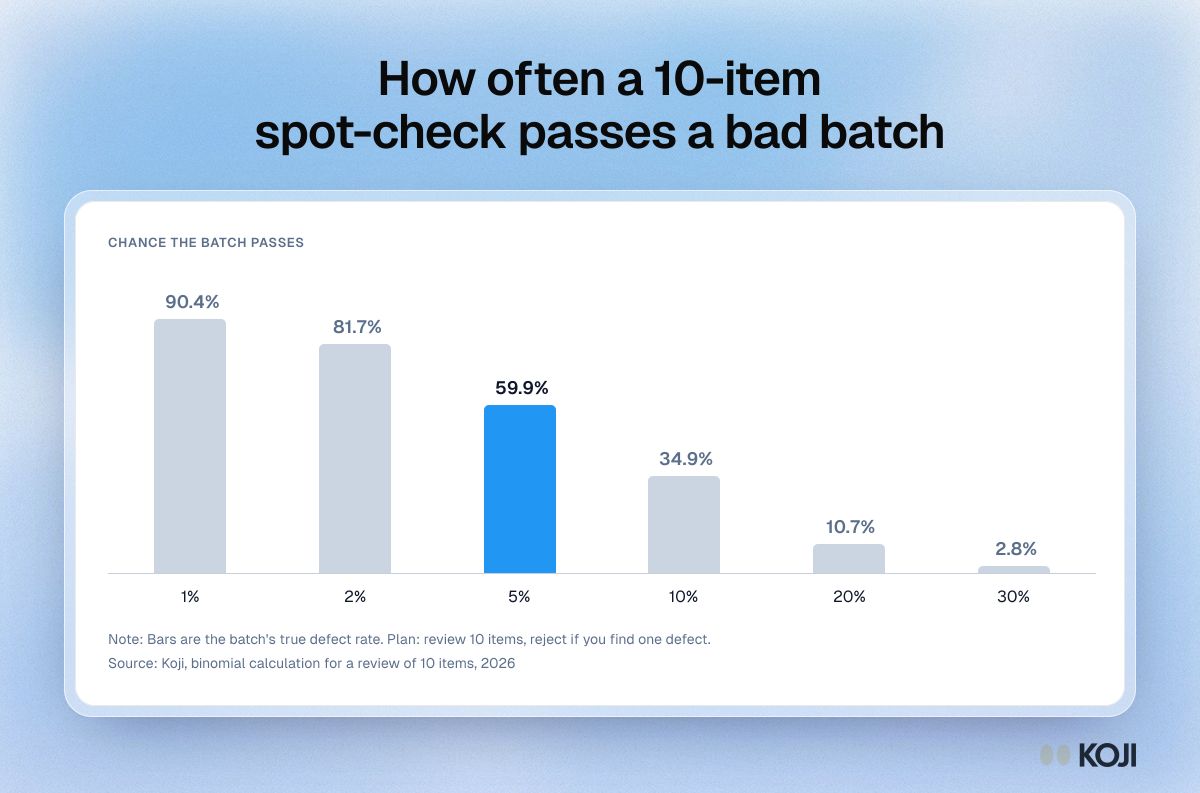
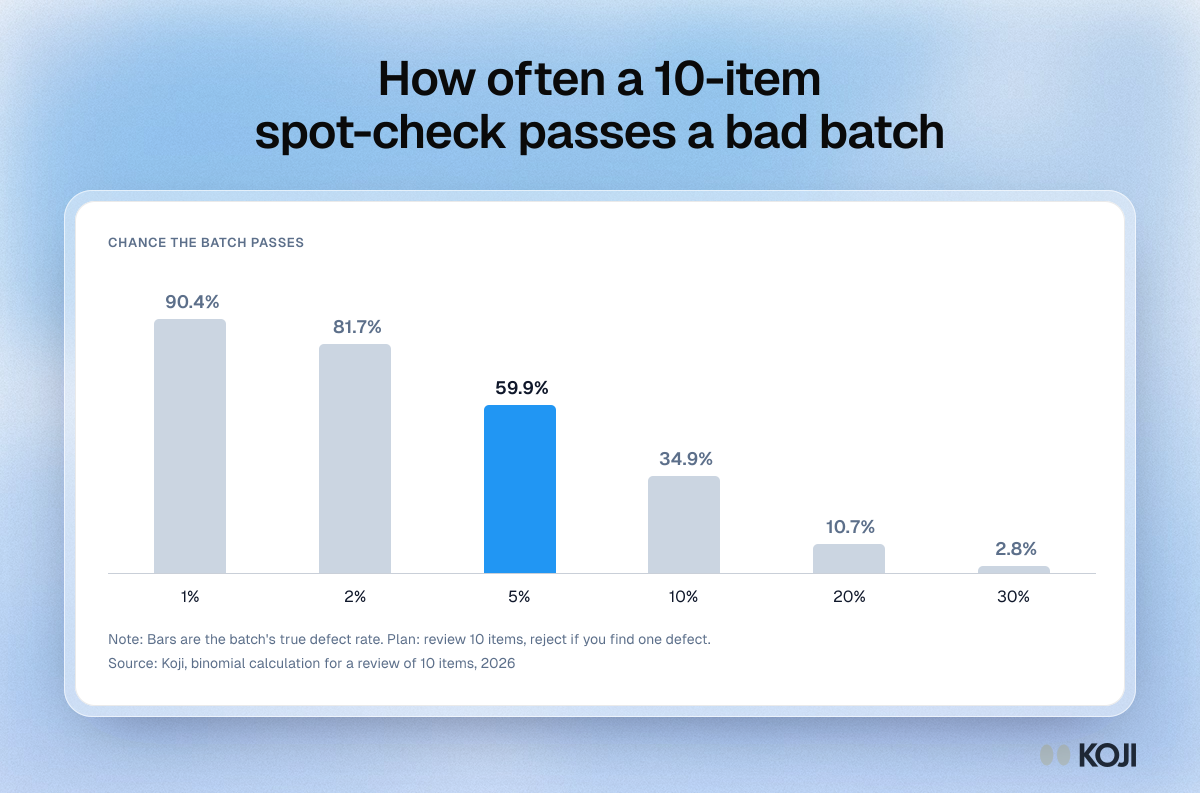
The chance that a strict spot-check, review ten items and reject on the first defect, accepts a batch at six true defect rates. It passes a 5% defective batch 59.9% of the time and a 10% batch 34.9% of the time. Use it when someone proposes reviewing a sample of transcripts as a quality gate. The figures come from the binomial distribution. Koji scores every interview instead of a sample.
Where this appears
What's in this column chart
| Chance batch passes | |
|---|---|
| 1% | 90.4% |
| 2% | 81.7% |
| 5% | 59.9% |
| 10% | 34.9% |
| 20% | 10.7% |
| 30% | 2.8% |
Bars are the batch's true defect rate. Plan: review 10 items, reject if you find one defect.
Use this image
Free to use in your docs, decks and posts under CC BY 4.0, as long as you credit Koji with a link to this page. To embed it, paste this into your page:
html
<a href="https://www.koji.so/visuals/ten-item-spot-check-acceptance-by-defect-rate"><img src="https://www.koji.so/visuals/ten-item-spot-check-acceptance-by-defect-rate/ten-item-spot-check-acceptance-by-defect-rate.png" alt="Column chart showing a 10-item spot-check passes a batch 90.4% of the time at 1% defects and 59.9% of the time at 5% defects." width="1200" height="793" /></a>
<p>Source: <a href="https://www.koji.so/visuals/ten-item-spot-check-acceptance-by-defect-rate">How often a 10-item spot-check passes a bad batch</a>, Koji</p>