Bar chart
Data teams in 2026: priorities, worries and spend
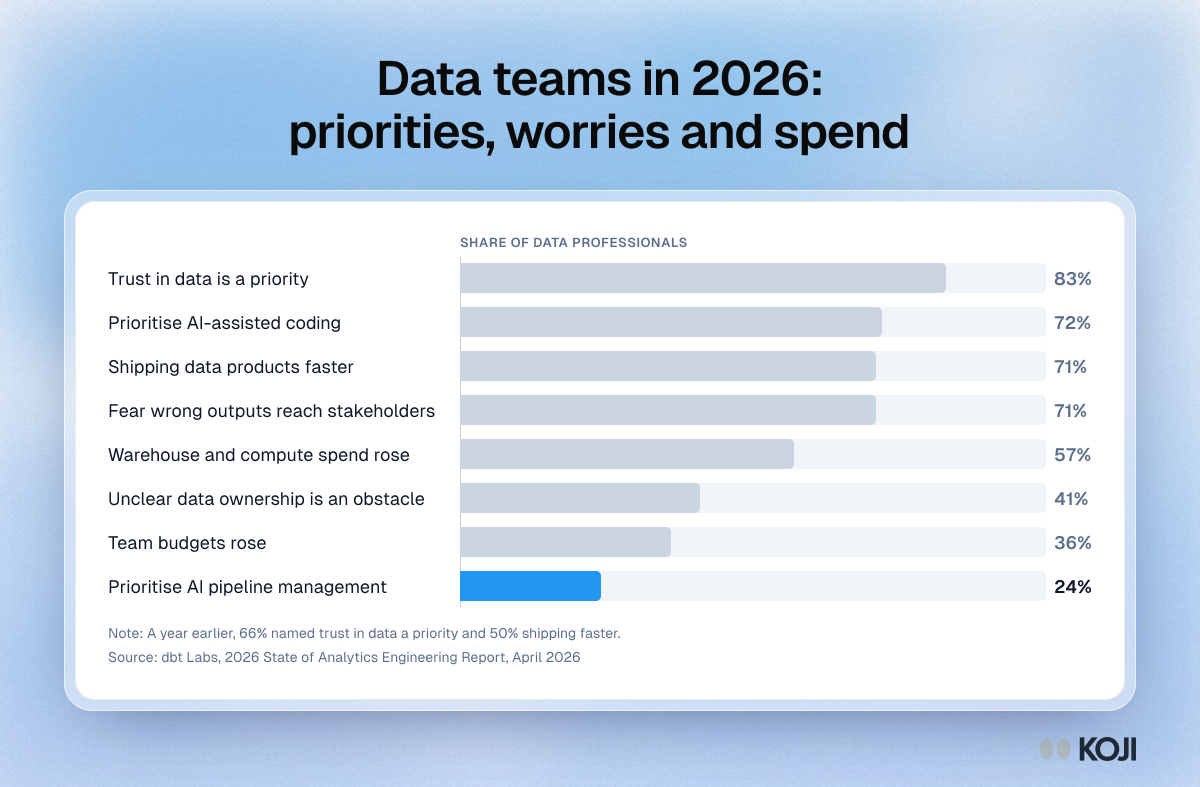
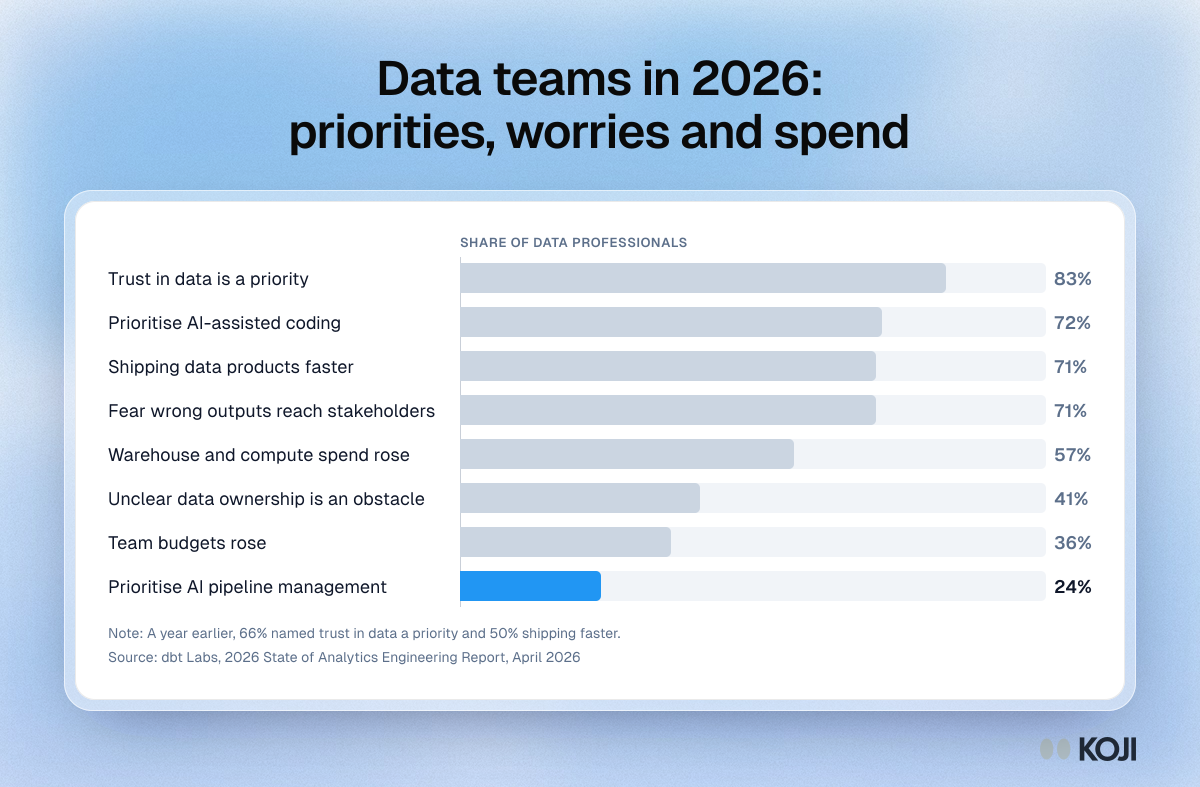
Eight results from dbt Labs' 2026 State of Analytics Engineering Report, released in April 2026. Trust in data jumped to 83% as a priority, yet only 24% of data professionals prioritise AI for pipeline testing and observability, against 72% for AI-assisted coding. Spend on warehouses rose for 57% while team budgets rose for 36%. Data leaders can use it to show why stakeholders keep asking for explanations the warehouse cannot give.
Where this appears
What's in this bar chart
| Share of data professionals | |
|---|---|
| Trust in data is a priority | 83% |
| Prioritise AI-assisted coding | 72% |
| Shipping data products faster | 71% |
| Fear wrong outputs reach stakeholders | 71% |
| Warehouse and compute spend rose | 57% |
| Unclear data ownership is an obstacle | 41% |
| Team budgets rose | 36% |
| Prioritise AI pipeline management | 24% |
A year earlier, 66% named trust in data a priority and 50% shipping faster.
Use this image
Free to use in your docs, decks and posts under CC BY 4.0, as long as you credit Koji with a link to this page. To embed it, paste this into your page:
html
<a href="https://www.koji.so/visuals/state-of-analytics-engineering-2026-survey-chart"><img src="https://www.koji.so/visuals/state-of-analytics-engineering-2026-survey-chart/state-of-analytics-engineering-2026-survey-chart.png" alt="Bar chart from the 2026 State of Analytics Engineering Report: 72% prioritise AI-assisted coding, but only 24% AI pipeline management." width="1200" height="787" /></a>
<p>Source: <a href="https://www.koji.so/visuals/state-of-analytics-engineering-2026-survey-chart">Data teams in 2026: priorities, worries and spend</a>, Koji</p>