Process
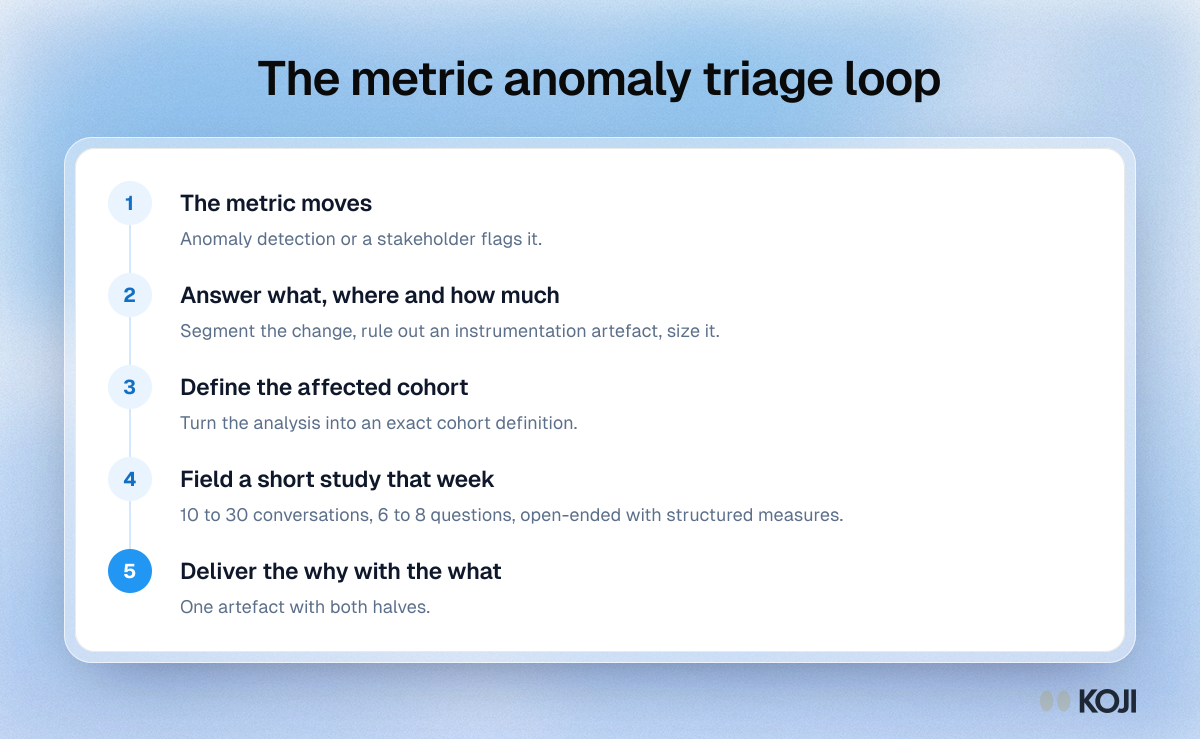
The metric anomaly triage loop
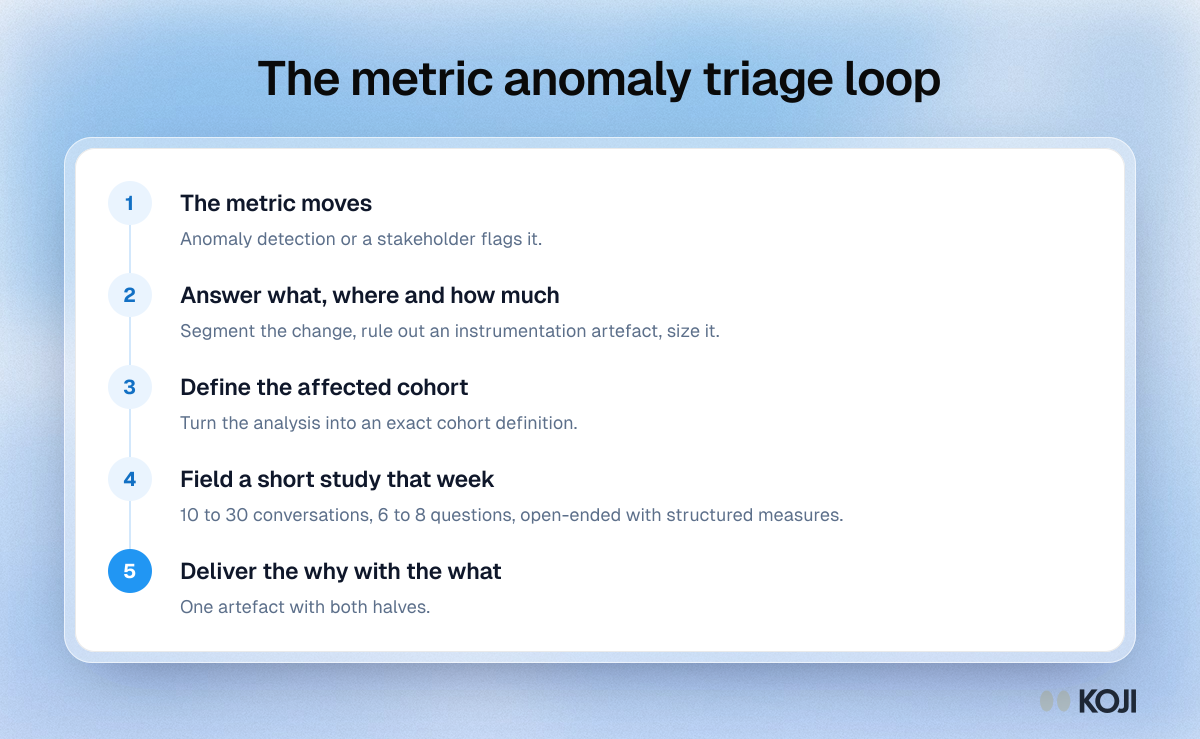
A five-step loop for data teams that need to explain a metric change, not only measure it. Size and segment the change, turn the result into an exact cohort, then field 10 to 30 short interviews with that cohort the same week and report both halves together. With AI-moderated interviews in Koji, the interview step takes hours rather than weeks.
Where this appears
What's in this process
- The metric moves: Anomaly detection or a stakeholder flags it.
- Answer what, where and how much: Segment the change, rule out an instrumentation artefact, size it.
- Define the affected cohort: Turn the analysis into an exact cohort definition.
- Field a short study that week: 10 to 30 conversations, 6 to 8 questions, open-ended with structured measures.
- Deliver the why with the what: One artefact with both halves.
Use this image
Free to use in your docs, decks and posts under CC BY 4.0, as long as you credit Koji with a link to this page. To embed it, paste this into your page:
html
<a href="https://www.koji.so/visuals/metric-anomaly-triage-loop-steps"><img src="https://www.koji.so/visuals/metric-anomaly-triage-loop-steps/metric-anomaly-triage-loop-steps.png" alt="Process diagram of the metric anomaly triage loop in five steps, from a metric moving to delivering the why alongside the what." width="1200" height="739" /></a>
<p>Source: <a href="https://www.koji.so/visuals/metric-anomaly-triage-loop-steps">The metric anomaly triage loop</a>, Koji</p>