Reference table
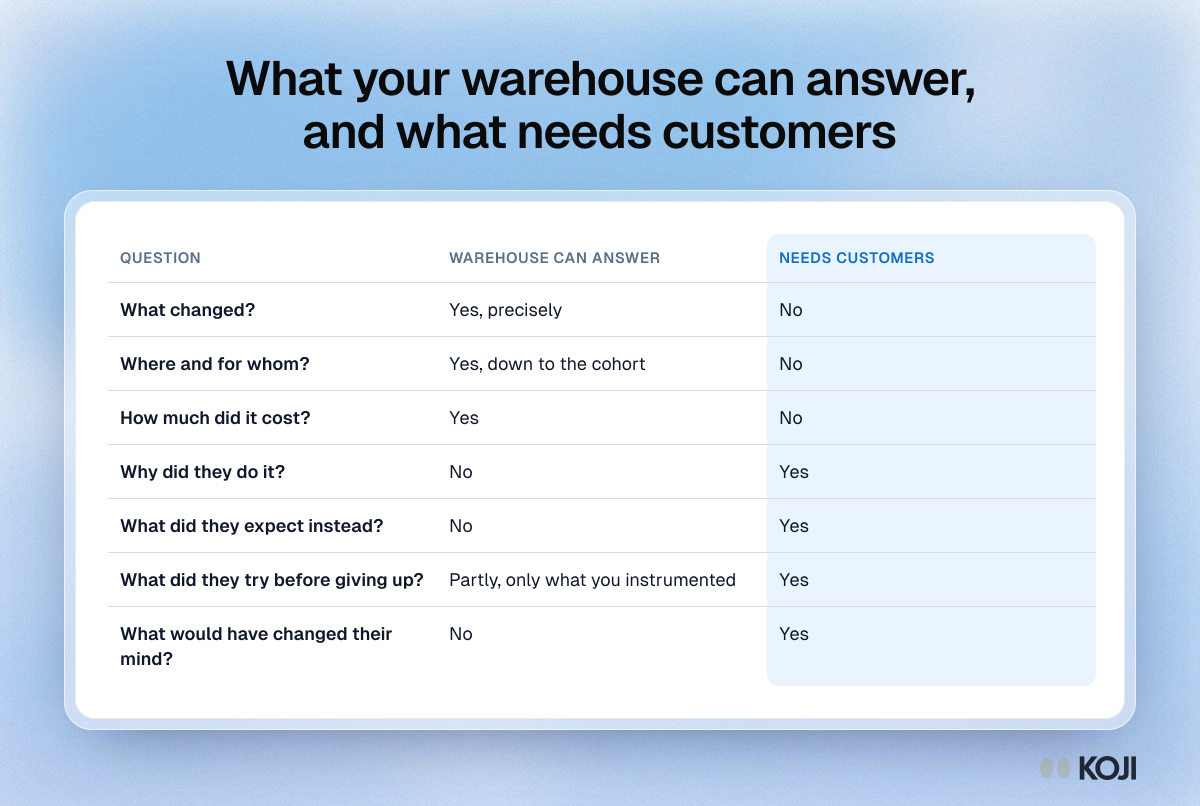
What your warehouse can answer, and what needs customers
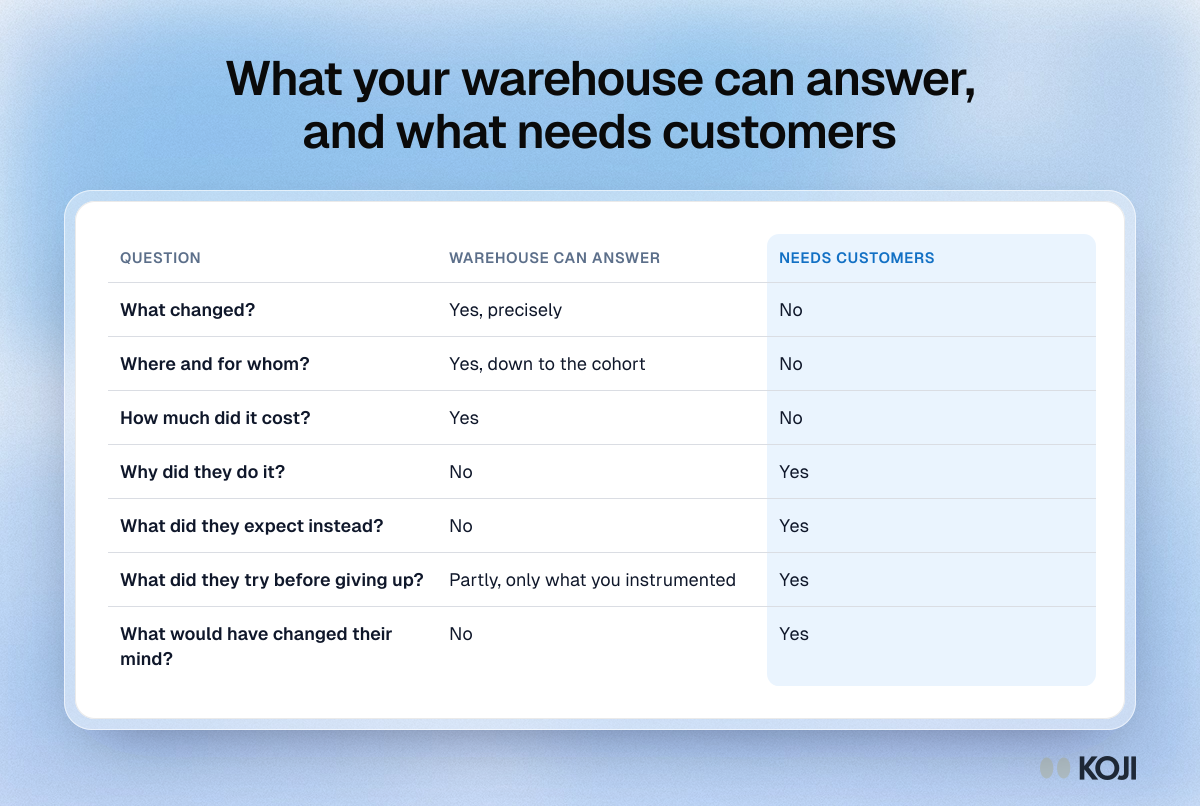
A table for data and analytics teams that splits the questions behind a metric change into the ones product data can answer and the ones that need customer conversations. The warehouse tells you what changed, for whom and what it cost. Motivation is never logged as an event, so why people acted, what they expected and what would have changed their mind all need interviews.
Where this appears
What's in this reference table
| Question | Warehouse can answer | Needs customers |
|---|---|---|
| What changed? | Yes, precisely | No |
| Where and for whom? | Yes, down to the cohort | No |
| How much did it cost? | Yes | No |
| Why did they do it? | No | Yes |
| What did they expect instead? | No | Yes |
| What did they try before giving up? | Partly, only what you instrumented | Yes |
| What would have changed their mind? | No | Yes |
Use this image
Free to use in your docs, decks and posts under CC BY 4.0, as long as you credit Koji with a link to this page. To embed it, paste this into your page:
html
<a href="https://www.koji.so/visuals/what-product-analytics-can-and-cannot-answer-table"><img src="https://www.koji.so/visuals/what-product-analytics-can-and-cannot-answer-table/what-product-analytics-can-and-cannot-answer-table.png" alt="Table of seven questions about a metric change, showing the warehouse answers what, where and how much, while why needs customers." width="1200" height="806" /></a>
<p>Source: <a href="https://www.koji.so/visuals/what-product-analytics-can-and-cannot-answer-table">What your warehouse can answer, and what needs customers</a>, Koji</p>