Bar chart
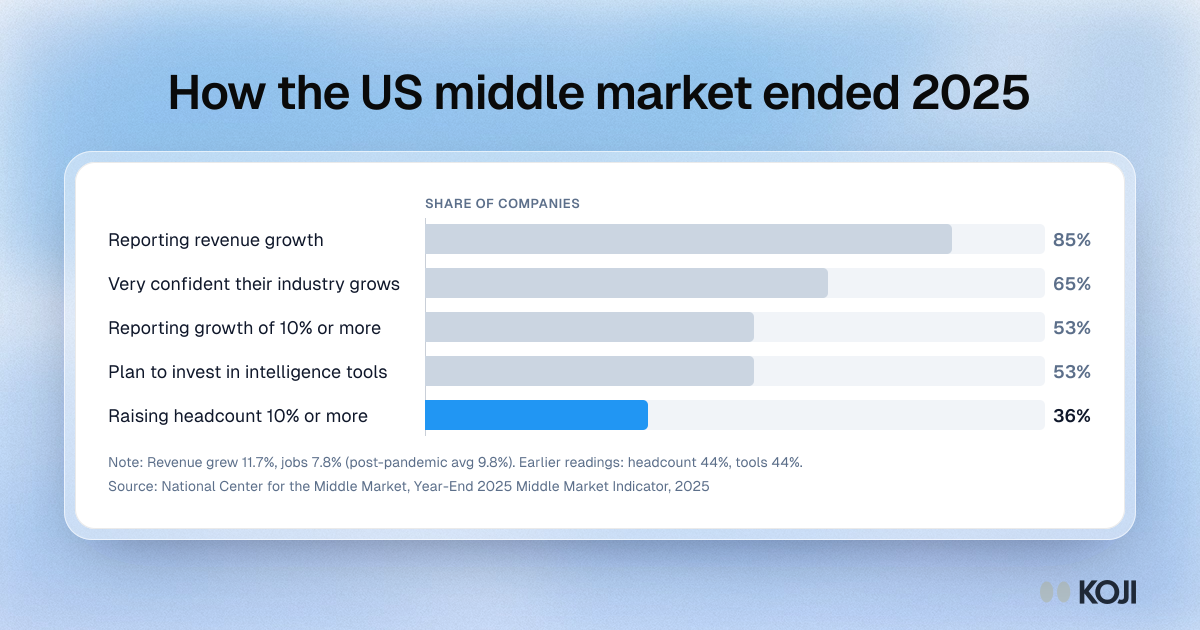
How the US middle market ended 2025
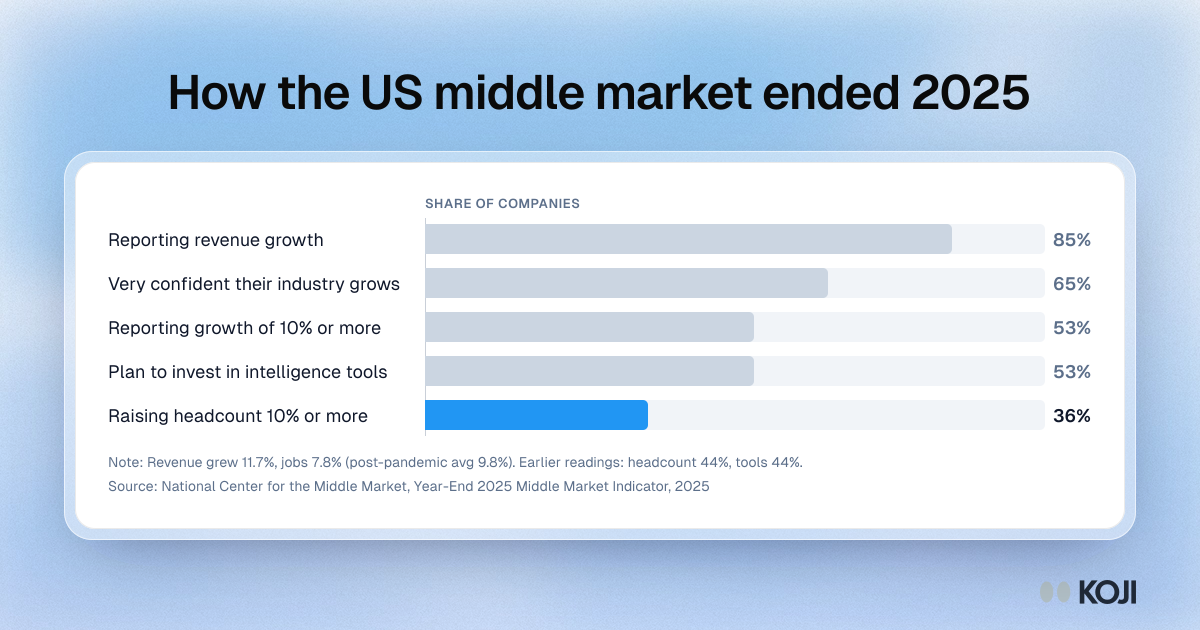
Five results from the National Center for the Middle Market's Year-End 2025 Middle Market Indicator, a survey of 1,000 C-suite executives at US companies with $10 million to $1 billion in revenue. Most firms grew revenue, but far fewer added staff at the same pace: average revenue growth was 11.7% against 7.8% for employment. Mid-market teams can use it to explain why research needs to run without new headcount.
Where this appears
What's in this bar chart
| Share of companies | |
|---|---|
| Reporting revenue growth | 85% |
| Very confident their industry grows | 65% |
| Reporting growth of 10% or more | 53% |
| Plan to invest in intelligence tools | 53% |
| Raising headcount 10% or more | 36% |
Revenue grew 11.7%, jobs 7.8% (post-pandemic avg 9.8%). Earlier readings: headcount 44%, tools 44%.
Use this image
Free to use in your docs, decks and posts under CC BY 4.0, as long as you credit Koji with a link to this page. To embed it, paste this into your page:
html
<a href="https://www.koji.so/visuals/middle-market-indicator-year-end-2025-bar-chart"><img src="https://www.koji.so/visuals/middle-market-indicator-year-end-2025-bar-chart/middle-market-indicator-year-end-2025-bar-chart.png" alt="Bar chart of the Year-End 2025 Middle Market Indicator: 85% of firms grew revenue, while only 36% raised headcount by 10% or more." width="1200" height="630" /></a>
<p>Source: <a href="https://www.koji.so/visuals/middle-market-indicator-year-end-2025-bar-chart">How the US middle market ended 2025</a>, Koji</p>