Column chart
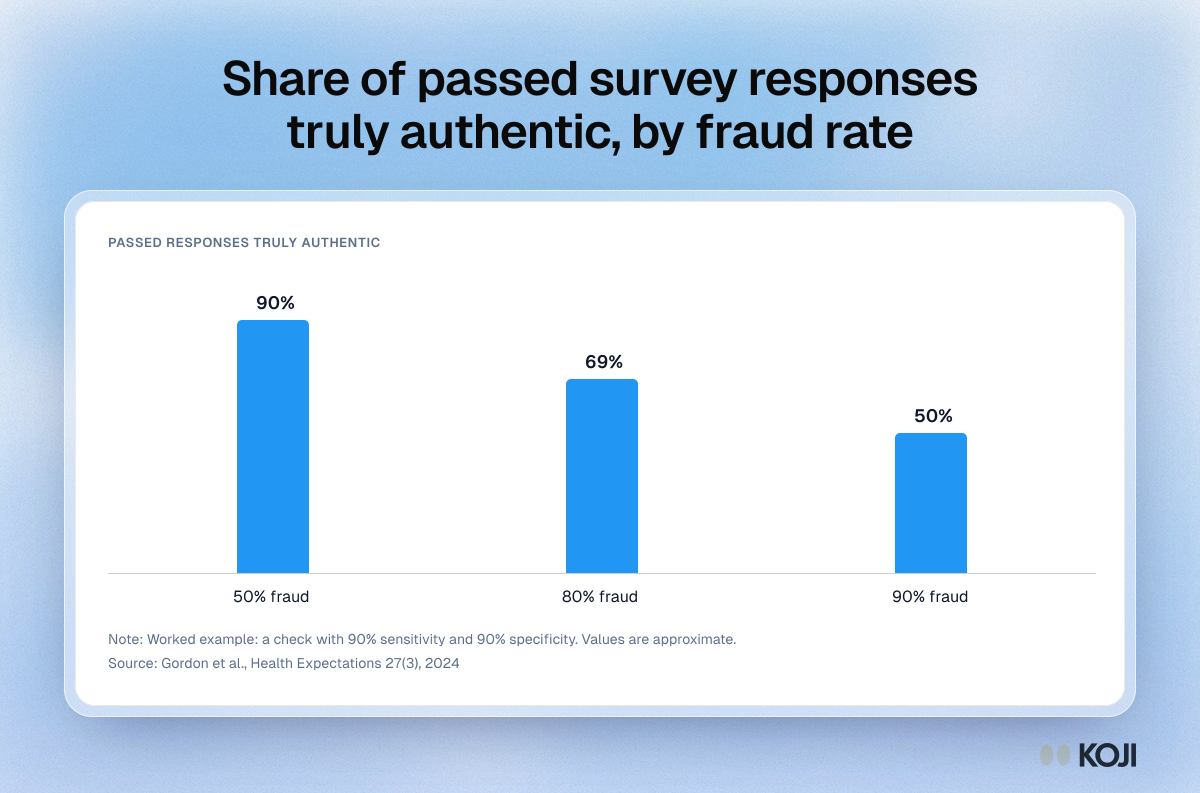
Share of passed survey responses truly authentic, by fraud rate
A worked Bayesian example from Gordon and colleagues on fraudulent survey respondents. With a check that has 90% sensitivity and 90% specificity, about 90% of the responses it passes are genuine when half the sample is fraudulent, 69% at 80% fraud and only 50% at 90%. It shows why review gets weakest exactly when data quality is worst. Koji stops many bad responses at capture instead.
Where this appears
What's in this column chart
| Truly authentic | |
|---|---|
| 50% fraud | 90% |
| 80% fraud | 69% |
| 90% fraud | 50% |
Worked example: a check with 90% sensitivity and 90% specificity. Values are approximate.
Use this image
Free to use in your docs, decks and posts under CC BY 4.0, as long as you credit Koji with a link to this page. To embed it, paste this into your page:
html
<a href="https://www.koji.so/visuals/fraud-prevalence-vs-detection-accuracy"><img src="https://www.koji.so/visuals/fraud-prevalence-vs-detection-accuracy/fraud-prevalence-vs-detection-accuracy.png" alt="Column chart showing responses passed as authentic are about 90% genuine at 50% fraud, 69% at 80% fraud and 50% at 90% fraud." width="1200" height="793" /></a>
<p>Source: <a href="https://www.koji.so/visuals/fraud-prevalence-vs-detection-accuracy">Share of passed survey responses truly authentic, by fraud rate</a>, Koji</p>