Column chart
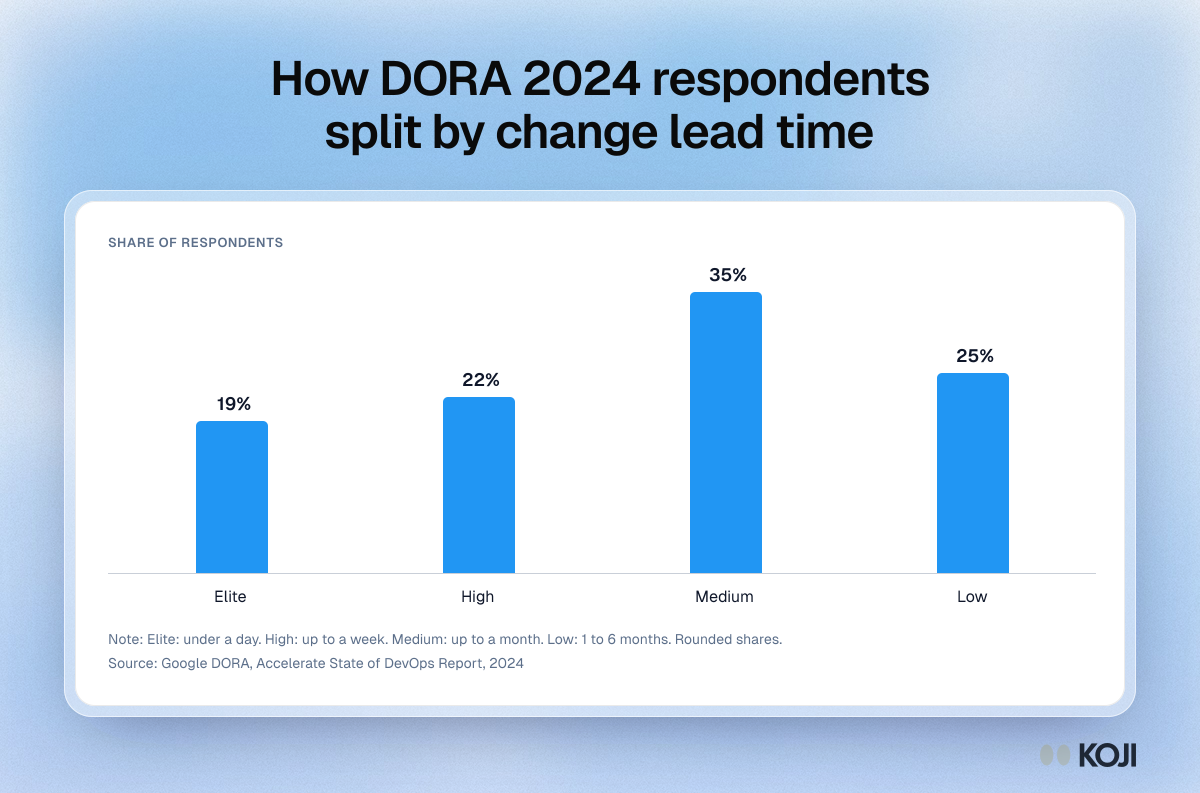
How DORA 2024 respondents split by change lead time
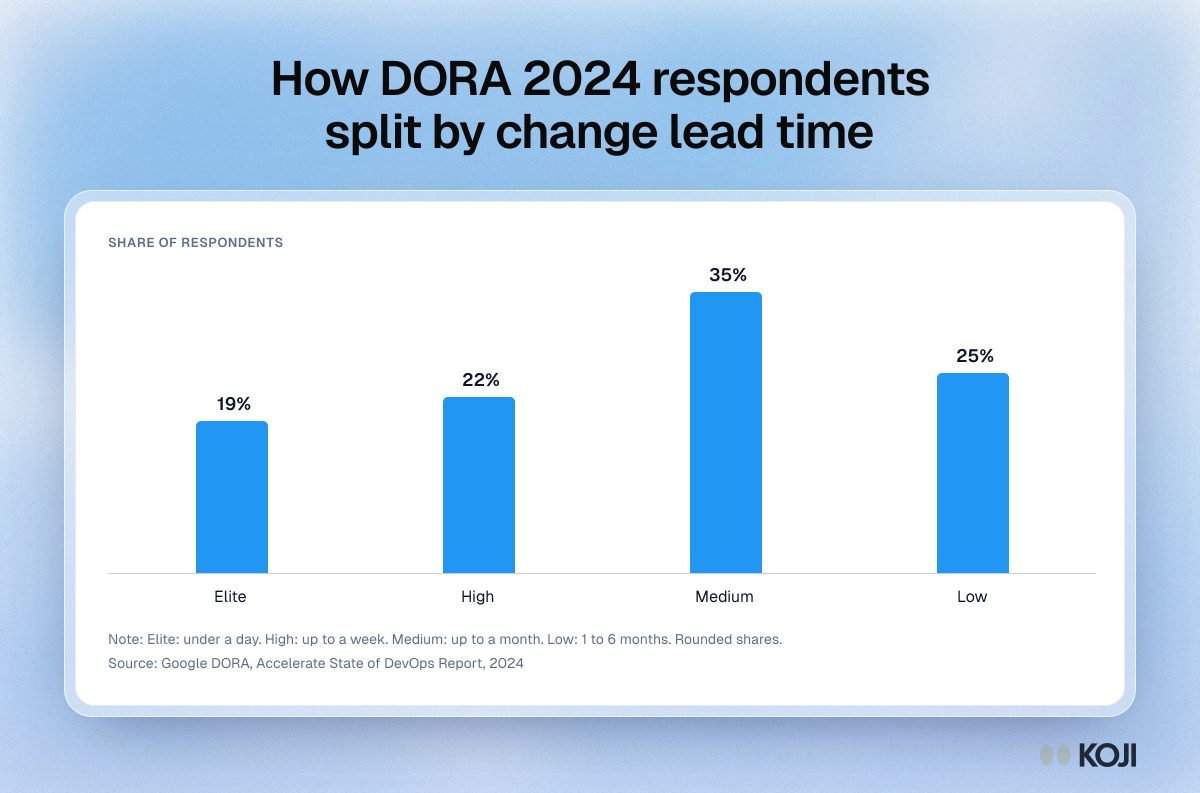
How respondents to Google's 2024 Accelerate State of DevOps Report split across four bands of change lead time, from under a day to up to six months. The unit of work, one change, is the same in every band, so the spread comes from batching, queues and handoffs rather than harder work. Research leaders can use it to show that lead time belongs to the queue. Koji helps research teams shorten that queue.
Where this appears
What's in this column chart
| Share of respondents | |
|---|---|
| Elite | 19% |
| High | 22% |
| Medium | 35% |
| Low | 25% |
Elite: under a day. High: up to a week. Medium: up to a month. Low: 1 to 6 months. Rounded shares.
Use this image
Free to use in your docs, decks and posts under CC BY 4.0, as long as you credit Koji with a link to this page. To embed it, paste this into your page:
html
<a href="https://www.koji.so/visuals/dora-2024-change-lead-time-bands"><img src="https://www.koji.so/visuals/dora-2024-change-lead-time-bands/dora-2024-change-lead-time-bands.png" alt="Column chart of DORA 2024 lead time bands: 19% elite, 22% high, 35% medium and 25% low performers by change lead time." width="1200" height="793" /></a>
<p>Source: <a href="https://www.koji.so/visuals/dora-2024-change-lead-time-bands">How DORA 2024 respondents split by change lead time</a>, Koji</p>