Column chart
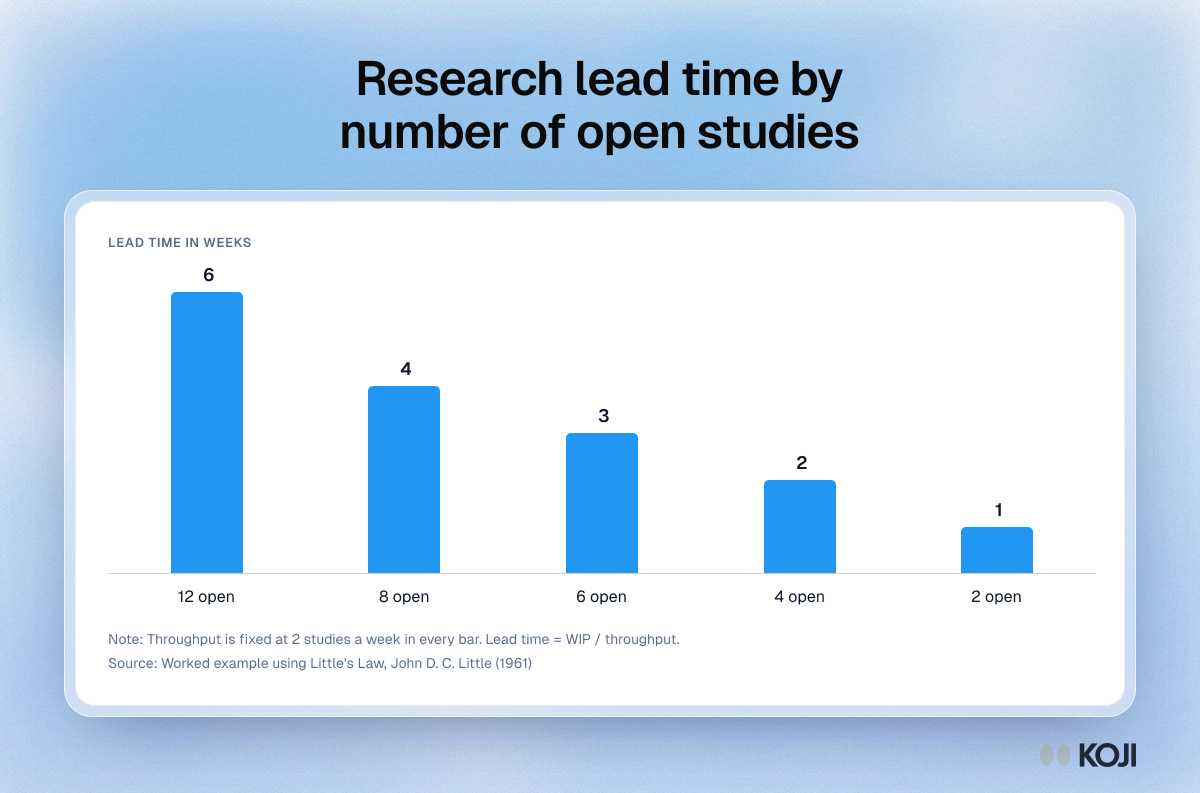
Research lead time by number of open studies
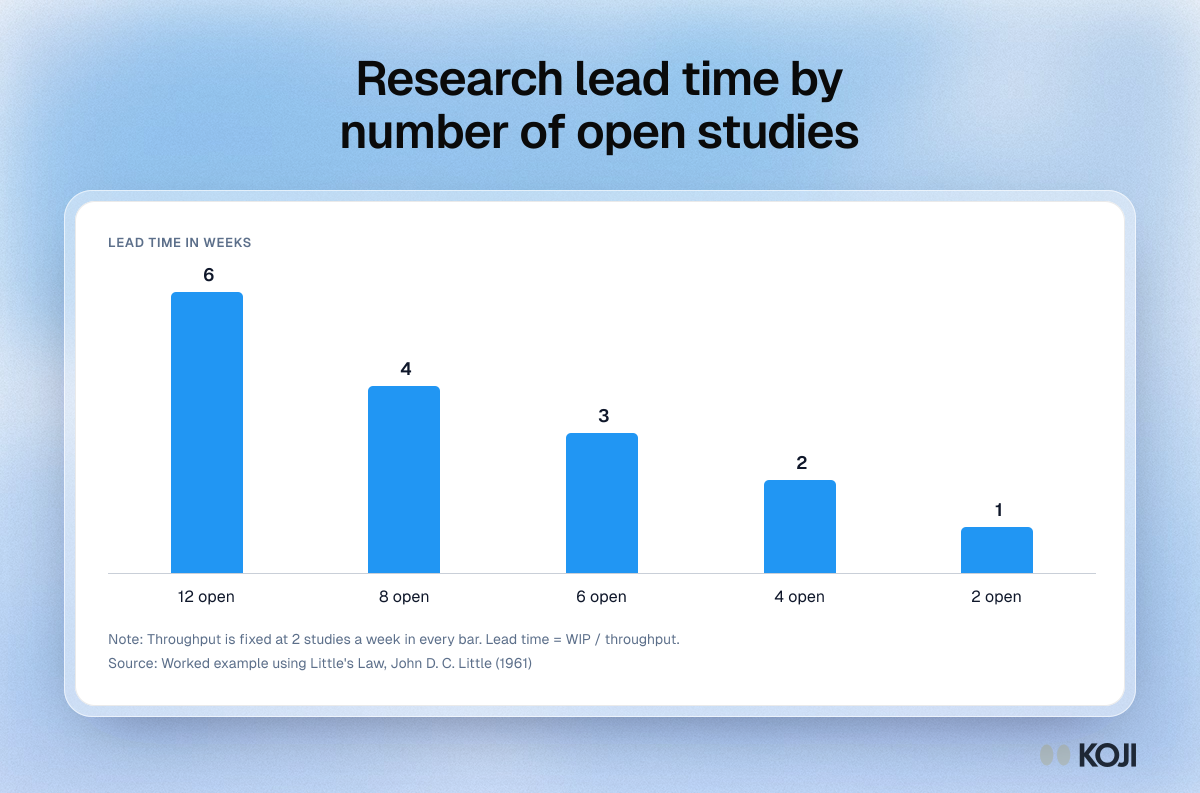
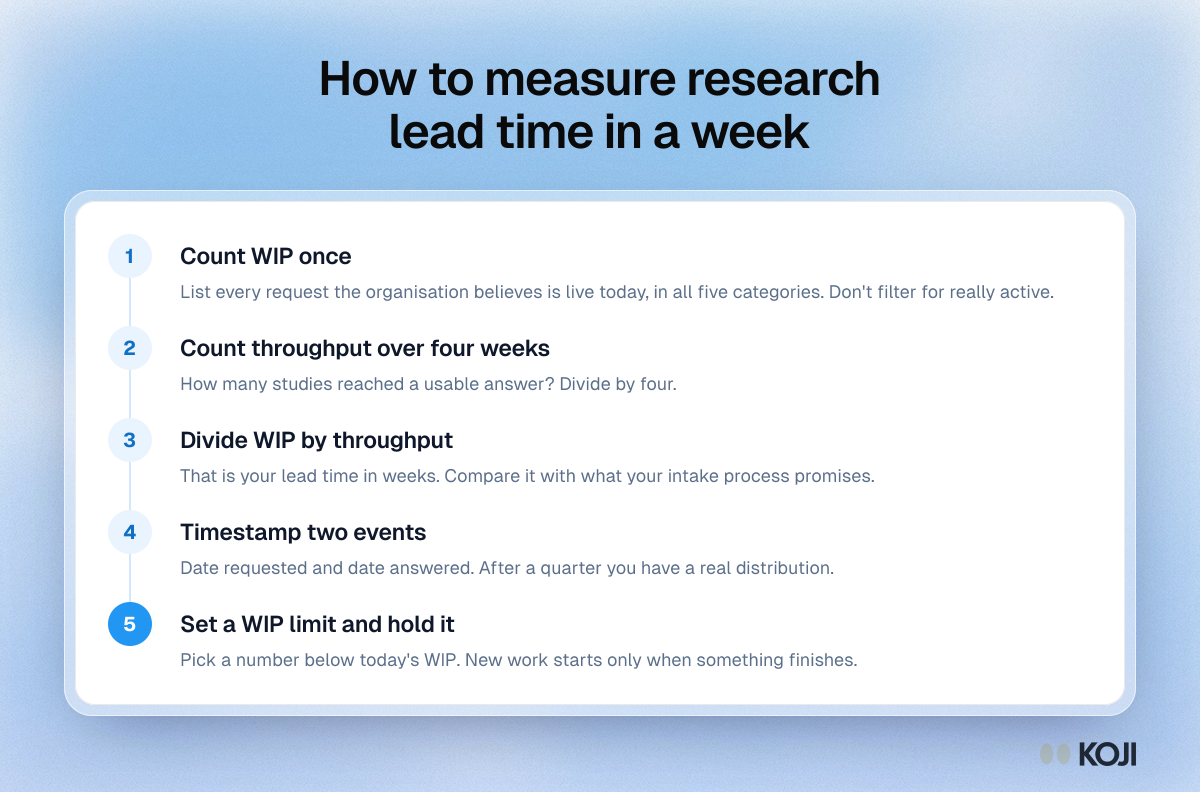
A worked example of Little's Law for a research team that finishes two studies a week. With 12 studies open, the average wait for an answer is 6 weeks. With 2 open, it is 1 week. Throughput never changes, only work-in-progress. Use it to make the case for a WIP limit before you try to speed up individual studies. Koji raises throughput with AI-moderated interviews that run in parallel.
Where this appears
What's in this column chart
| Lead time | |
|---|---|
| 12 open | 6 |
| 8 open | 4 |
| 6 open | 3 |
| 4 open | 2 |
| 2 open | 1 |
Throughput is fixed at 2 studies a week in every bar. Lead time = WIP / throughput.
Use this image
Free to use in your docs, decks and posts under CC BY 4.0, as long as you credit Koji with a link to this page. To embed it, paste this into your page:
html
<a href="https://www.koji.so/visuals/research-lead-time-by-work-in-progress"><img src="https://www.koji.so/visuals/research-lead-time-by-work-in-progress/research-lead-time-by-work-in-progress.png" alt="Column chart showing research lead time falling from 6 weeks with 12 open studies to 1 week with 2, at a steady 2 studies a week." width="1200" height="793" /></a>
<p>Source: <a href="https://www.koji.so/visuals/research-lead-time-by-work-in-progress">Research lead time by number of open studies</a>, Koji</p>