Reference table
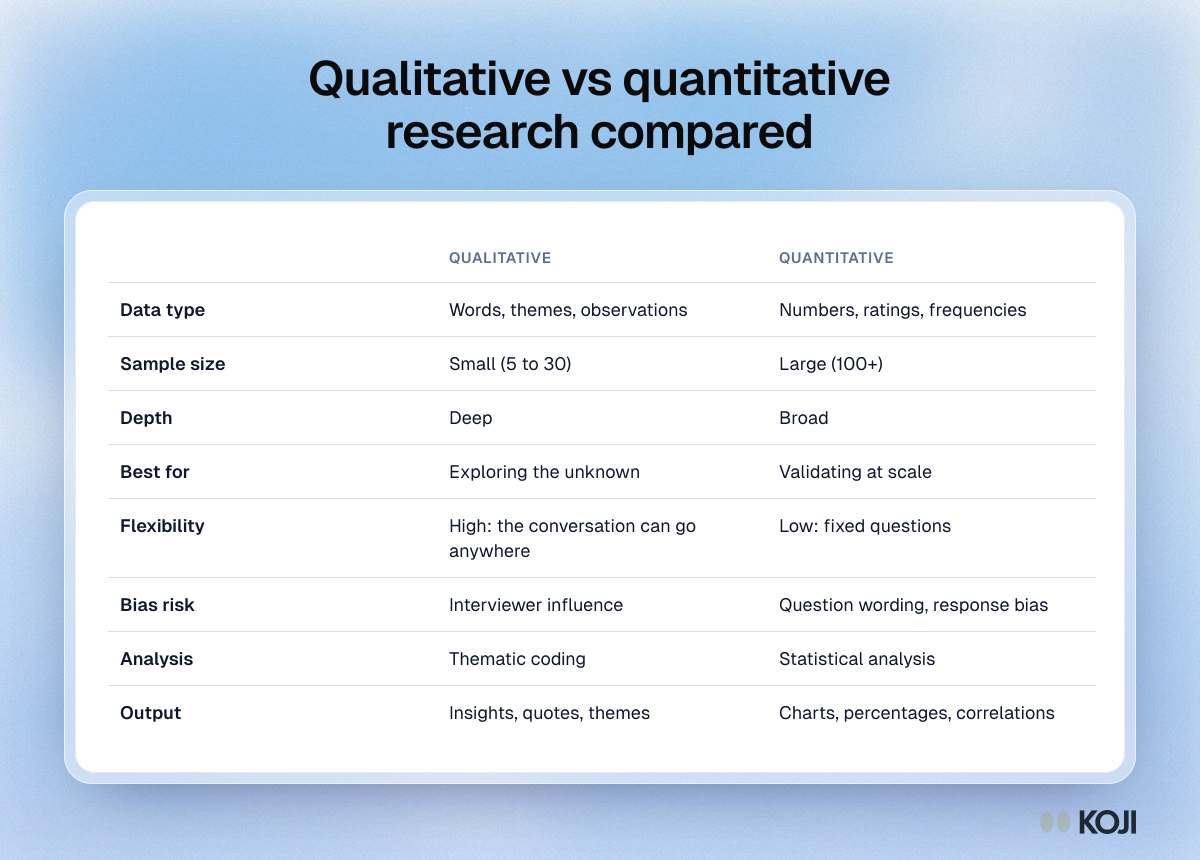
Qualitative vs quantitative research compared
Eight dimensions, from sample size to the output you get
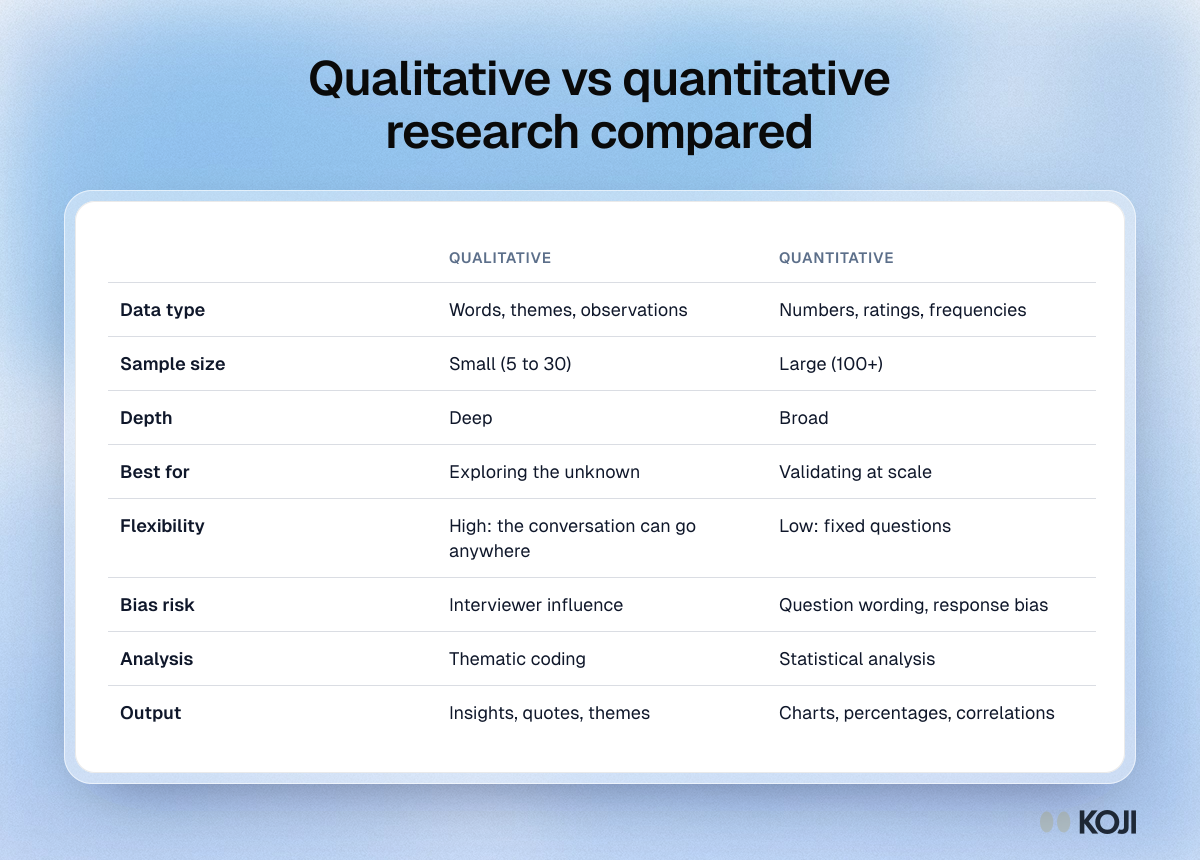
A reference table comparing qualitative and quantitative research across eight dimensions: the kind of data, typical sample size (5 to 30 against 100 or more), depth, what each is best for, flexibility, where bias creeps in, how it is analyzed and what it produces. Use it to pick a method for a research question or to explain the choice to stakeholders. Koji runs AI-moderated interviews, which lets the qualitative side reach larger samples than a team could moderate by hand.
Where this appears
What's in this reference table
| Qualitative | Quantitative | |
|---|---|---|
| Data type | Words, themes, observations | Numbers, ratings, frequencies |
| Sample size | Small (5 to 30) | Large (100+) |
| Depth | Deep | Broad |
| Best for | Exploring the unknown | Validating at scale |
| Flexibility | High: the conversation can go anywhere | Low: fixed questions |
| Bias risk | Interviewer influence | Question wording, response bias |
| Analysis | Thematic coding | Statistical analysis |
| Output | Insights, quotes, themes | Charts, percentages, correlations |
Use this image
Free to use in your docs, decks and posts under CC BY 4.0, as long as you credit Koji with a link to this page. To embed it, paste this into your page:
html
<a href="https://www.koji.so/visuals/qualitative-vs-quantitative-research-comparison-table"><img src="https://www.koji.so/visuals/qualitative-vs-quantitative-research-comparison-table/qualitative-vs-quantitative-research-comparison-table.png" alt="Table comparing qualitative and quantitative research on data type, sample size, depth, best use, flexibility, bias risk, analysis and output" width="1200" height="860" /></a>
<p>Source: <a href="https://www.koji.so/visuals/qualitative-vs-quantitative-research-comparison-table">Qualitative vs quantitative research compared</a>, Koji</p>