Reference table
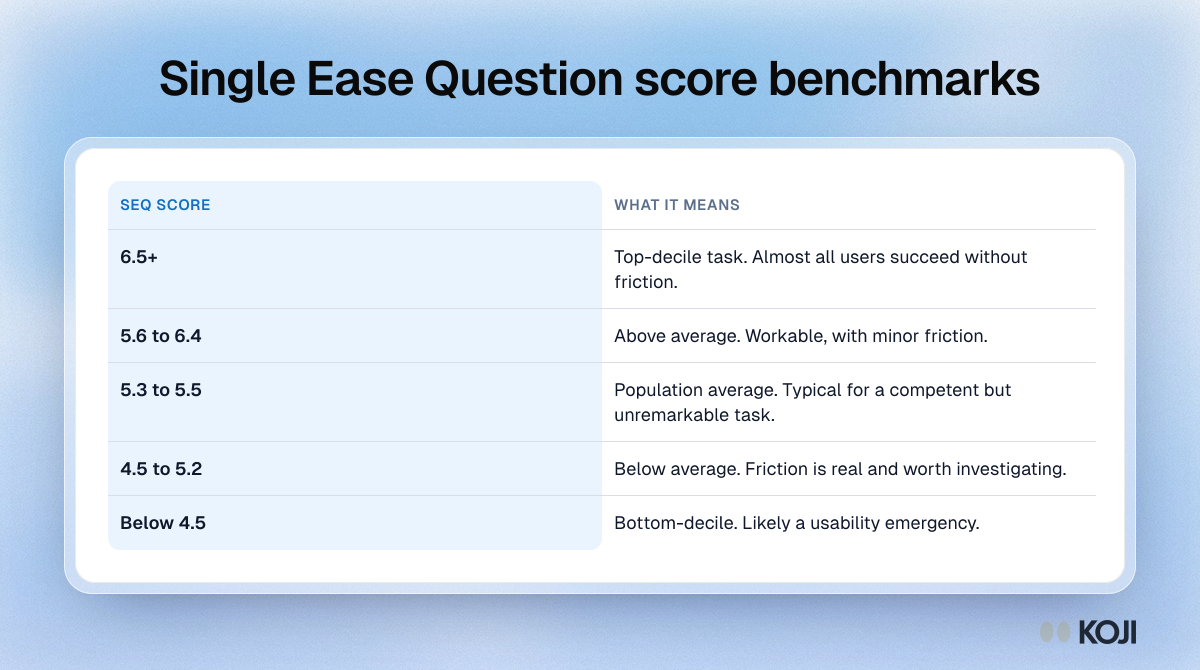
Single Ease Question score benchmarks
What a good or bad SEQ score looks like on the 7-point scale
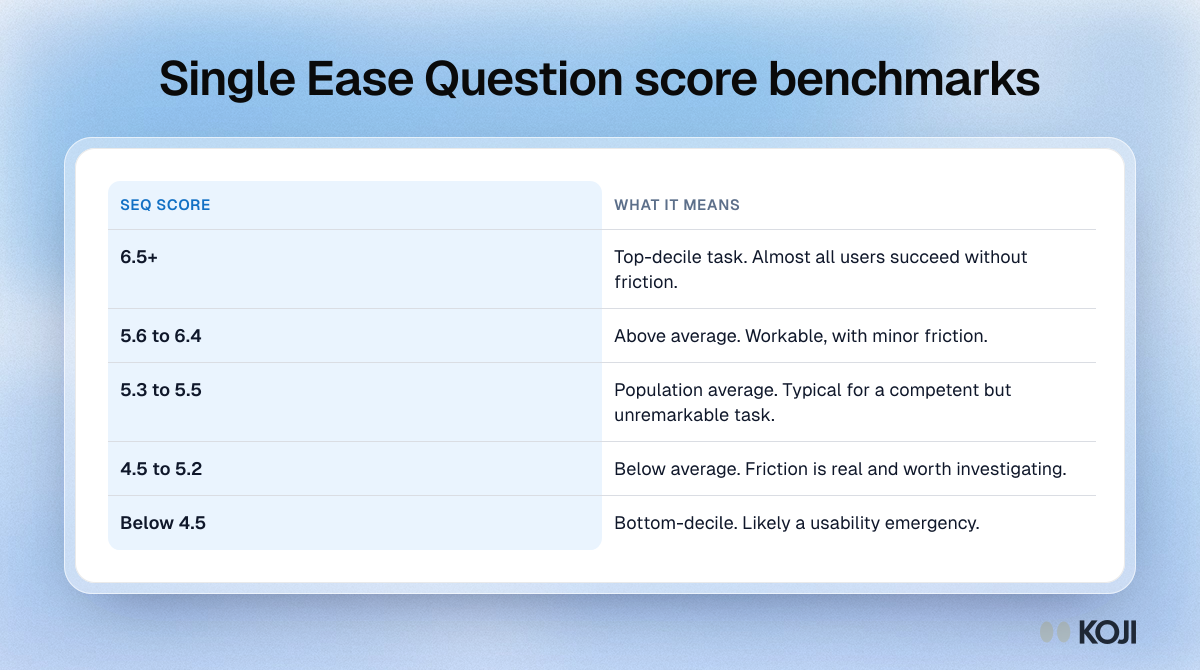
How to read a Single Ease Question score on its 7-point scale. Scores of 6.5 and above are top-decile tasks, 5.3 to 5.5 is the population average, and anything below 4.5 is a likely usability emergency. The ranges come from MeasuringU's benchmark data across more than 400 tasks and 10,000 users. Use them to judge whether a task's score is a problem worth fixing.
Where this appears
What's in this reference table
| SEQ score | What it means |
|---|---|
| 6.5+ | Top-decile task. Almost all users succeed without friction. |
| 5.6 to 6.4 | Above average. Workable, with minor friction. |
| 5.3 to 5.5 | Population average. Typical for a competent but unremarkable task. |
| 4.5 to 5.2 | Below average. Friction is real and worth investigating. |
| Below 4.5 | Bottom-decile. Likely a usability emergency. |
Use this image
Free to use in your docs, decks and posts under CC BY 4.0, as long as you credit Koji with a link to this page. To embed it, paste this into your page:
html
<a href="https://www.koji.so/visuals/seq-score-benchmarks-table"><img src="https://www.koji.so/visuals/seq-score-benchmarks-table/seq-score-benchmarks-table.png" alt="Table of Single Ease Question score ranges from 6.5 and above to below 4.5, with what each range means for a task, based on MeasuringU benchmarks." width="1200" height="670" /></a>
<p>Source: <a href="https://www.koji.so/visuals/seq-score-benchmarks-table">Single Ease Question score benchmarks</a>, Koji</p>