Reference table
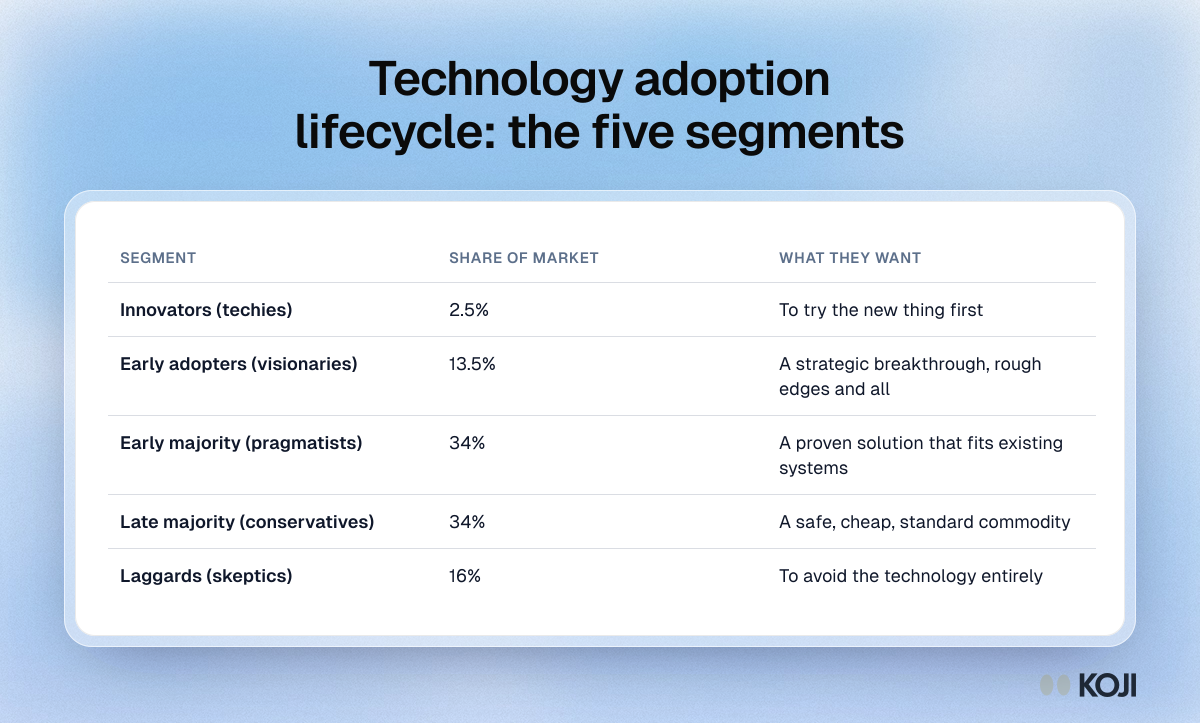
Technology adoption lifecycle: the five segments
Each segment's share of the market and what it wants from a new product
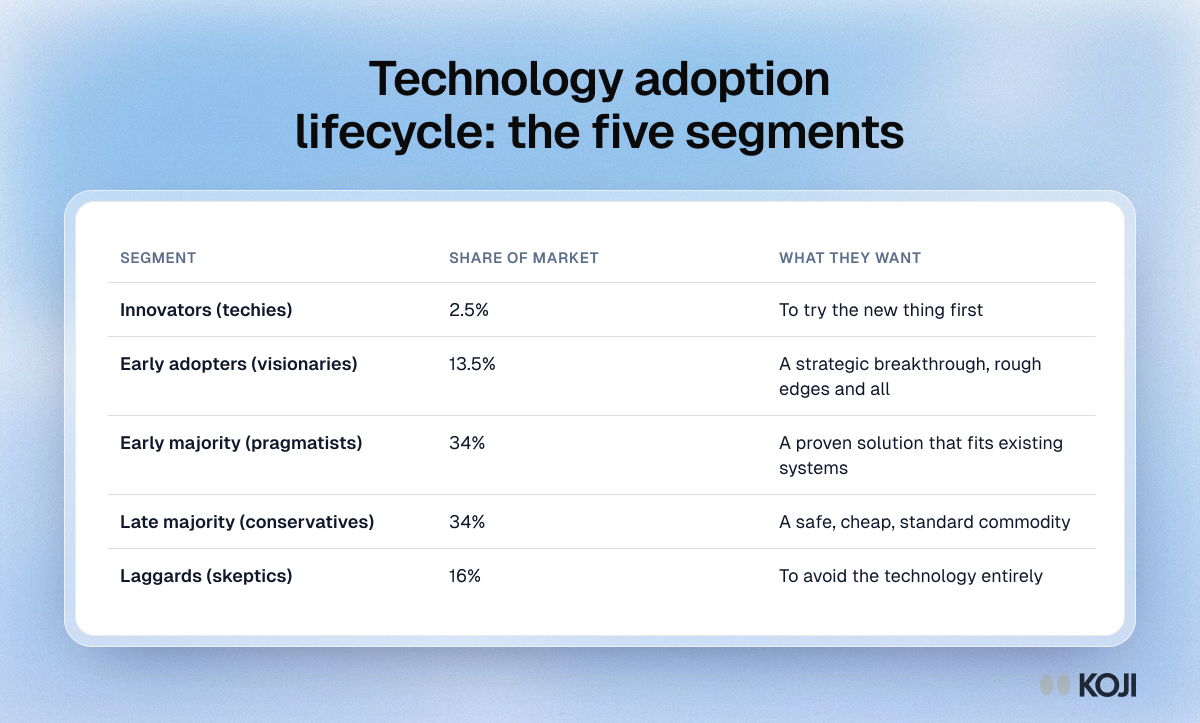
The five segments of the technology adoption lifecycle, with each group's share of the market and what it wants from a new product. Rogers described the curve, and Moore showed there is a gap between early adopters and the early majority. Use it to check which kind of buyer you are really talking to before you scale your spend. Interviews with each segment show where the pain is sharpest.
What's in this reference table
| Segment | Share of market | What they want |
|---|---|---|
| Innovators (techies) | 2.5% | To try the new thing first |
| Early adopters (visionaries) | 13.5% | A strategic breakthrough, rough edges and all |
| Early majority (pragmatists) | 34% | A proven solution that fits existing systems |
| Late majority (conservatives) | 34% | A safe, cheap, standard commodity |
| Laggards (skeptics) | 16% | To avoid the technology entirely |
Use this image
Free to use in your docs, decks and posts under CC BY 4.0, as long as you credit Koji with a link to this page. To embed it, paste this into your page:
html
<a href="https://www.koji.so/visuals/technology-adoption-lifecycle-five-segments-table"><img src="https://www.koji.so/visuals/technology-adoption-lifecycle-five-segments-table/technology-adoption-lifecycle-five-segments-table.png" alt="Table of the adoption lifecycle: innovators 2.5%, early adopters 13.5%, early majority 34%, late majority 34% and laggards 16%, plus what each wants." width="1200" height="723" /></a>
<p>Source: <a href="https://www.koji.so/visuals/technology-adoption-lifecycle-five-segments-table">Technology adoption lifecycle: the five segments</a>, Koji</p>