Column chart
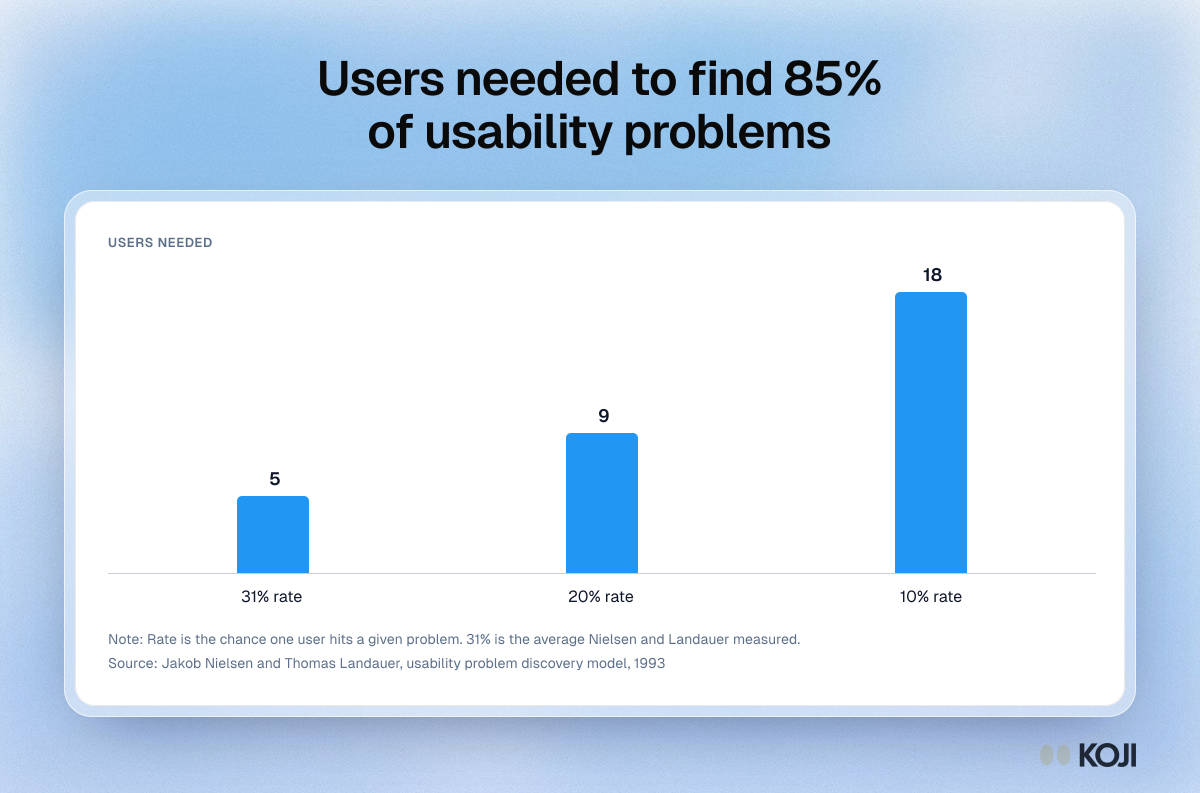
Users needed to find 85% of usability problems
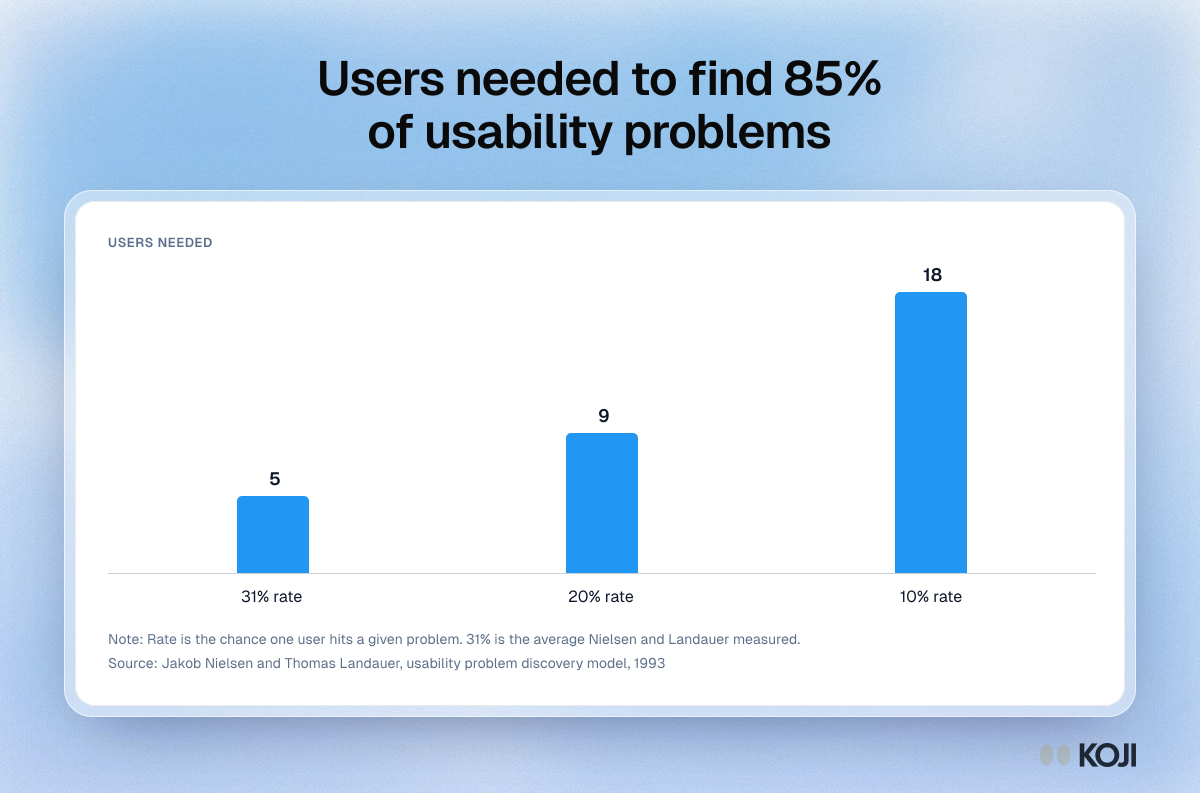
Chart of how many test users it takes to find about 85% of the usability problems in an interface, depending on how likely one user is to hit each problem. At the 31% average rate Nielsen and Landauer measured, 5 users are enough. At 20% it takes about 9, and at 10% roughly 18. Use it to size a qualitative usability test around how subtle your problems are.
Where this appears
What's in this column chart
| Users needed | |
|---|---|
| 31% rate | 5 |
| 20% rate | 9 |
| 10% rate | 18 |
Rate is the chance one user hits a given problem. 31% is the average Nielsen and Landauer measured.
Use this image
Free to use in your docs, decks and posts under CC BY 4.0, as long as you credit Koji with a link to this page. To embed it, paste this into your page:
html
<a href="https://www.koji.so/visuals/users-needed-to-find-85-percent-usability-problems"><img src="https://www.koji.so/visuals/users-needed-to-find-85-percent-usability-problems/users-needed-to-find-85-percent-usability-problems.png" alt="Column chart of the users needed to find 85% of usability problems: 5 users at a 31% discovery rate, 9 at 20% and 18 at 10%." width="1200" height="793" /></a>
<p>Source: <a href="https://www.koji.so/visuals/users-needed-to-find-85-percent-usability-problems">Users needed to find 85% of usability problems</a>, Koji</p>