Reference table
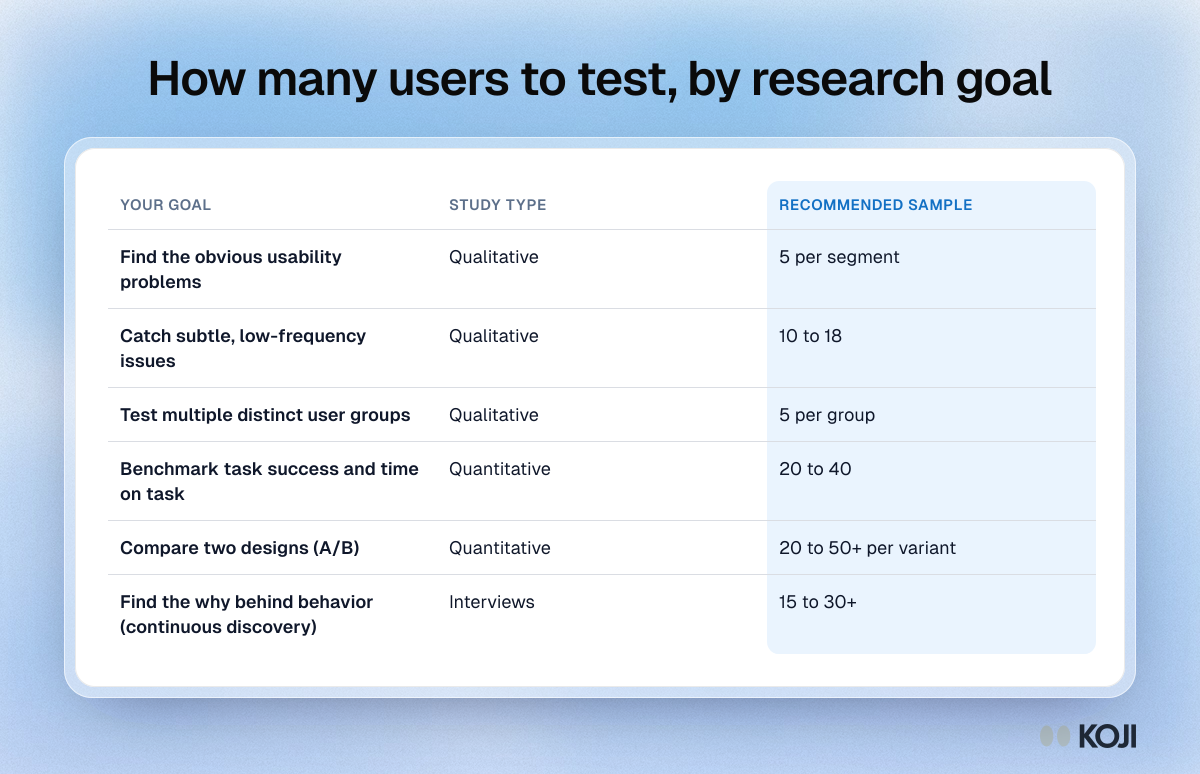
How many users to test, by research goal
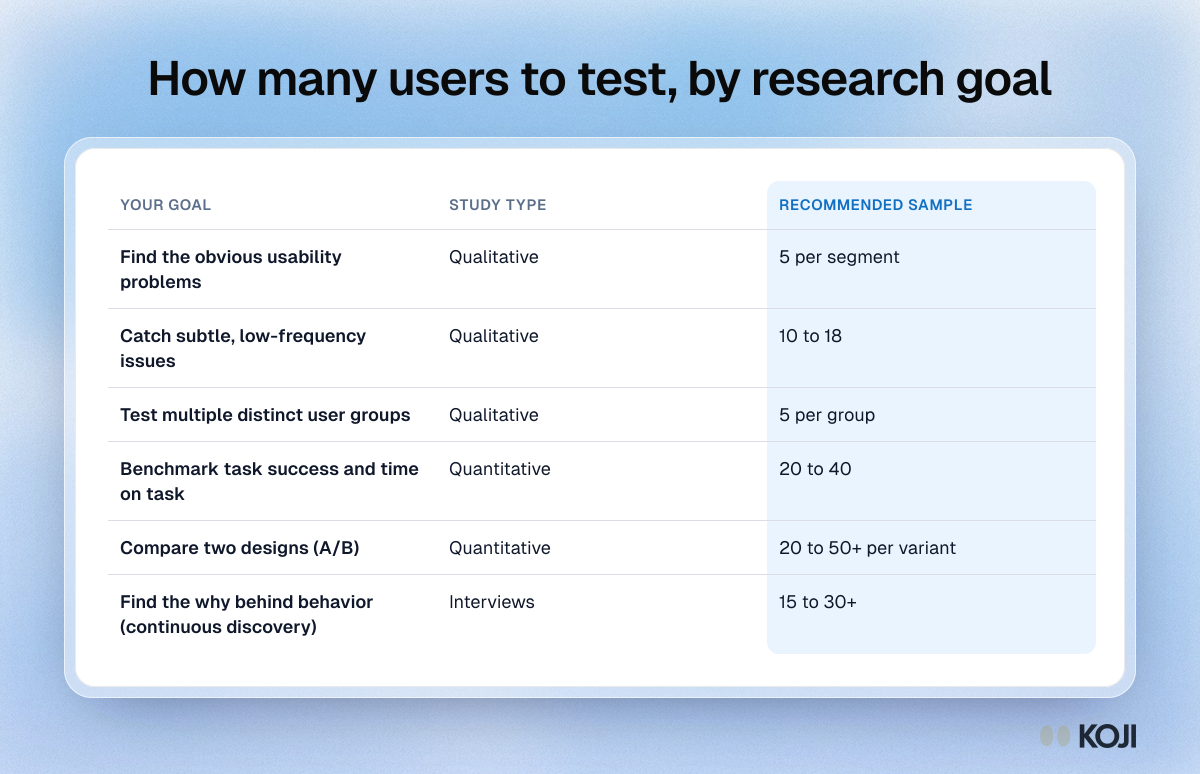
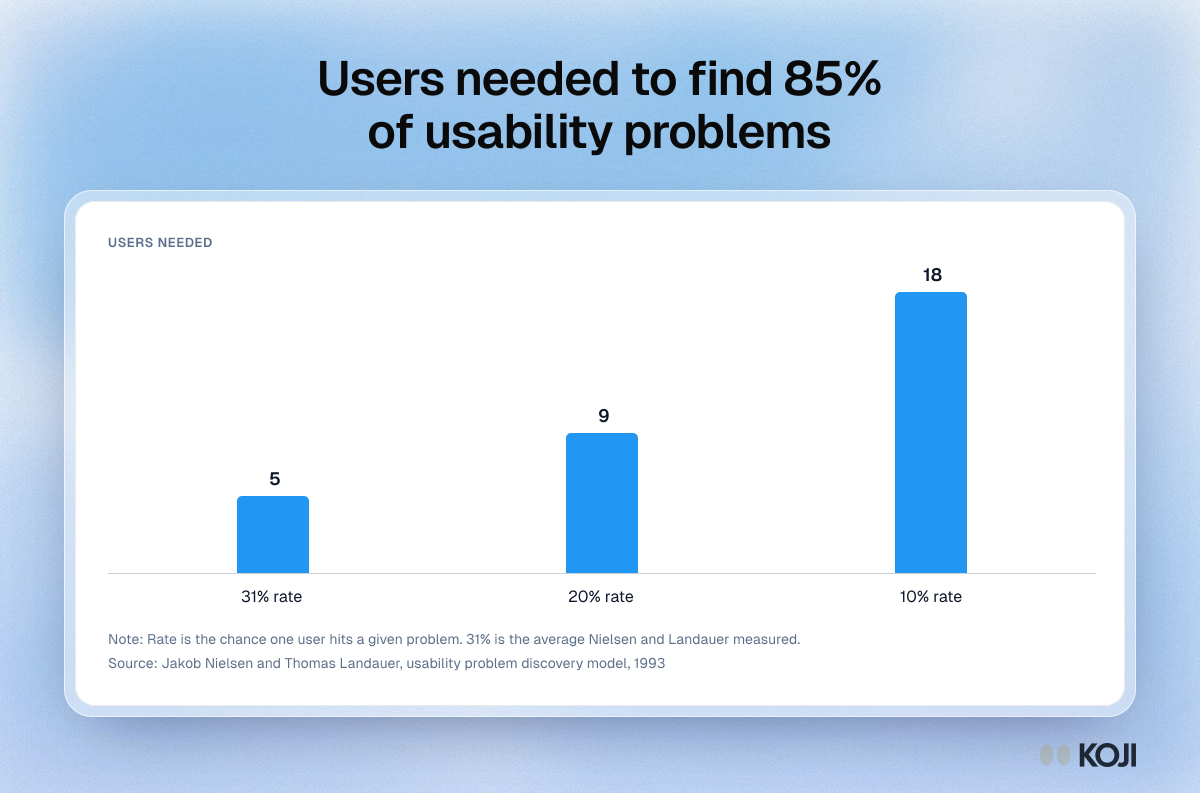
Table of recommended sample sizes for six kinds of usability and discovery research, from 5 users per segment to find obvious problems to 20 to 40 users to benchmark task success. It is for researchers and product teams planning a test who need a number they can defend. The qualitative rows rest on the Nielsen and Landauer problem discovery model, and the quantitative rows use the usual 20 to 40 participant range.
Where this appears
What's in this reference table
| Your goal | Study type | Recommended sample |
|---|---|---|
| Find the obvious usability problems | Qualitative | 5 per segment |
| Catch subtle, low-frequency issues | Qualitative | 10 to 18 |
| Test multiple distinct user groups | Qualitative | 5 per group |
| Benchmark task success and time on task | Quantitative | 20 to 40 |
| Compare two designs (A/B) | Quantitative | 20 to 50+ per variant |
| Find the why behind behavior (continuous discovery) | Interviews | 15 to 30+ |
Use this image
Free to use in your docs, decks and posts under CC BY 4.0, as long as you credit Koji with a link to this page. To embed it, paste this into your page:
html
<a href="https://www.koji.so/visuals/how-many-users-usability-testing-by-research-goal"><img src="https://www.koji.so/visuals/how-many-users-usability-testing-by-research-goal/how-many-users-usability-testing-by-research-goal.png" alt="Table of usability test sample sizes by research goal, from 5 users per segment for obvious problems to 20 to 50 plus per variant for design comparisons." width="1200" height="774" /></a>
<p>Source: <a href="https://www.koji.so/visuals/how-many-users-usability-testing-by-research-goal">How many users to test, by research goal</a>, Koji</p>