Reference table
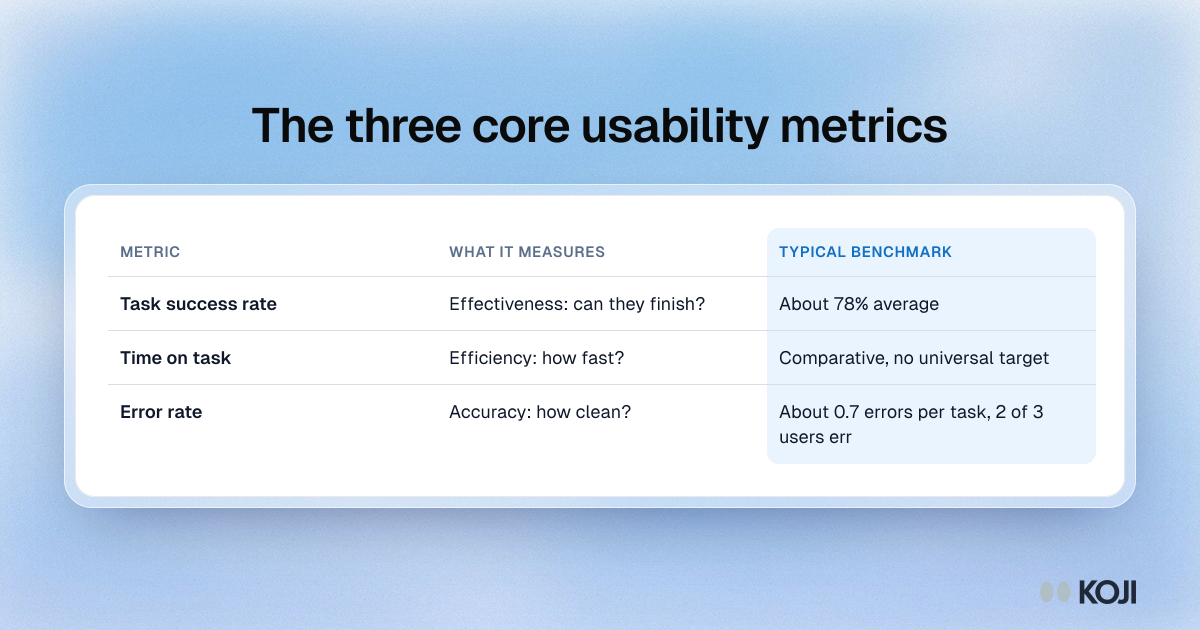
The three core usability metrics
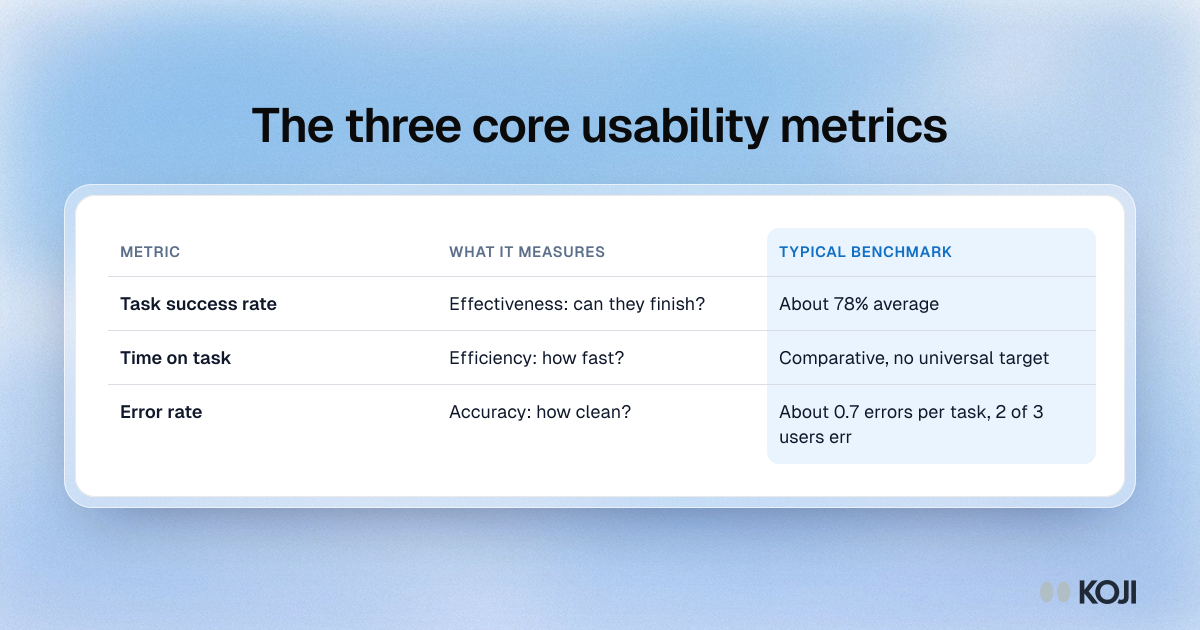
Table of the three core usability metrics and the benchmark for each. Task success rate measures effectiveness and averages about 78%. Time on task measures efficiency and is best used to compare designs. Error rate measures accuracy, with an average of 0.7 errors per task and about two in three users making at least one error. It is for UX researchers and product teams building a usability scorecard.
What's in this reference table
| Metric | What it measures | Typical benchmark |
|---|---|---|
| Task success rate | Effectiveness: can they finish? | About 78% average |
| Time on task | Efficiency: how fast? | Comparative, no universal target |
| Error rate | Accuracy: how clean? | About 0.7 errors per task, 2 of 3 users err |
Use this image
Free to use in your docs, decks and posts under CC BY 4.0, as long as you credit Koji with a link to this page. To embed it, paste this into your page:
html
<a href="https://www.koji.so/visuals/core-usability-metrics-success-time-errors-table"><img src="https://www.koji.so/visuals/core-usability-metrics-success-time-errors-table/core-usability-metrics-success-time-errors-table.png" alt="Table of the three core usability metrics with benchmarks: task success rate, about 78%; time on task, comparative; error rate, about 0.7 per task." width="1200" height="630" /></a>
<p>Source: <a href="https://www.koji.so/visuals/core-usability-metrics-success-time-errors-table">The three core usability metrics</a>, Koji</p>