Bar chart
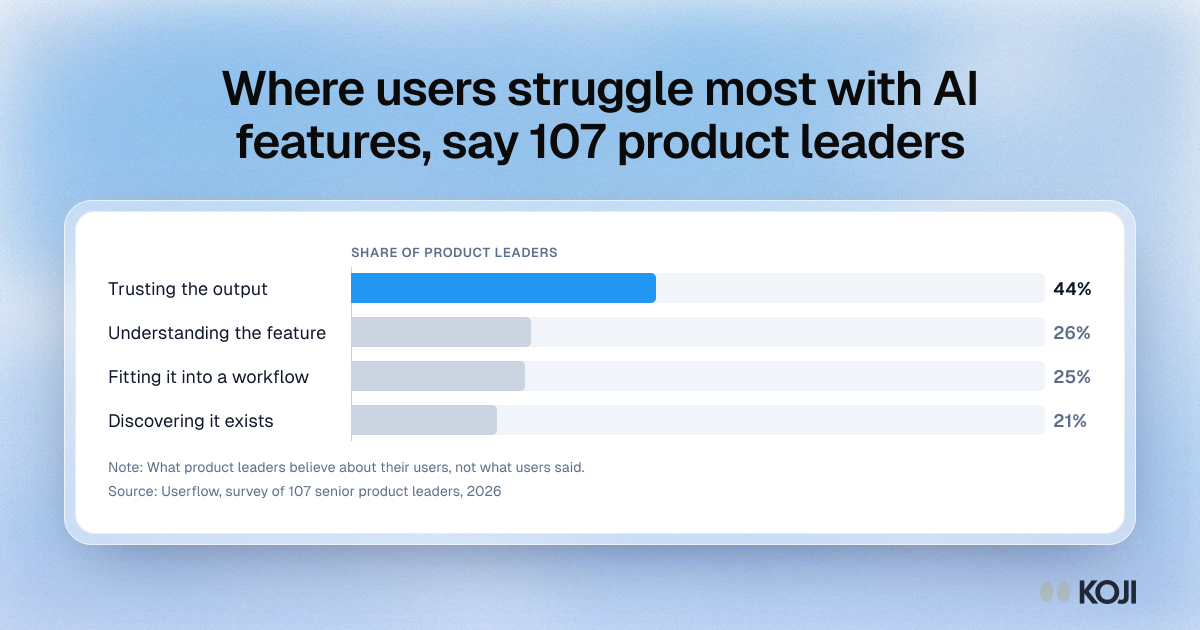
Where users struggle most with AI features, say 107 product leaders
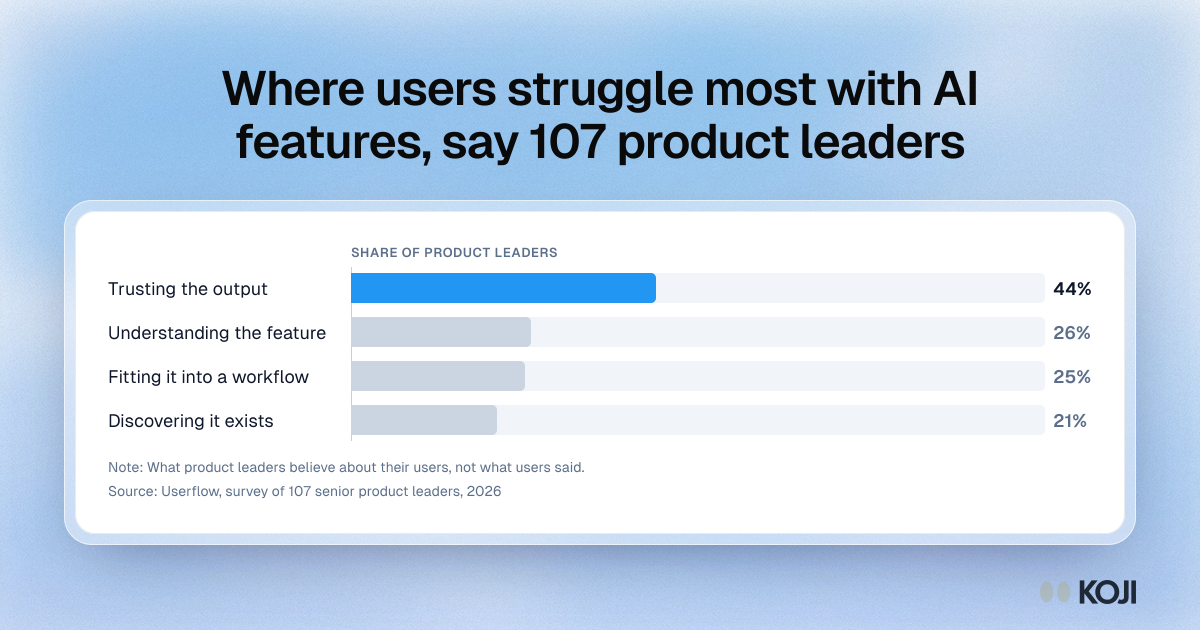
Results from Userflow's 2026 survey of 107 senior product leaders on where users struggle most with AI features. Trusting the output came first at 44%, ahead of understanding the feature, fitting it into a workflow and discovering it exists. These are product leaders' views of their users, so treat them as a starting hypothesis to test in interviews with the users themselves.
Where this appears
What's in this bar chart
| Product leaders | |
|---|---|
| Trusting the output | 44% |
| Understanding the feature | 26% |
| Fitting it into a workflow | 25% |
| Discovering it exists | 21% |
What product leaders believe about their users, not what users said.
Use this image
Free to use in your docs, decks and posts under CC BY 4.0, as long as you credit Koji with a link to this page. To embed it, paste this into your page:
html
<a href="https://www.koji.so/visuals/where-users-struggle-with-ai-features-product-leader-survey"><img src="https://www.koji.so/visuals/where-users-struggle-with-ai-features-product-leader-survey/where-users-struggle-with-ai-features-product-leader-survey.png" alt="Bar chart of where product leaders say users struggle with AI features: trusting the output 44%, understanding it 26%, workflow fit 25%, discovery 21%." width="1200" height="630" /></a>
<p>Source: <a href="https://www.koji.so/visuals/where-users-struggle-with-ai-features-product-leader-survey">Where users struggle most with AI features, say 107 product leaders</a>, Koji</p>