Bar chart
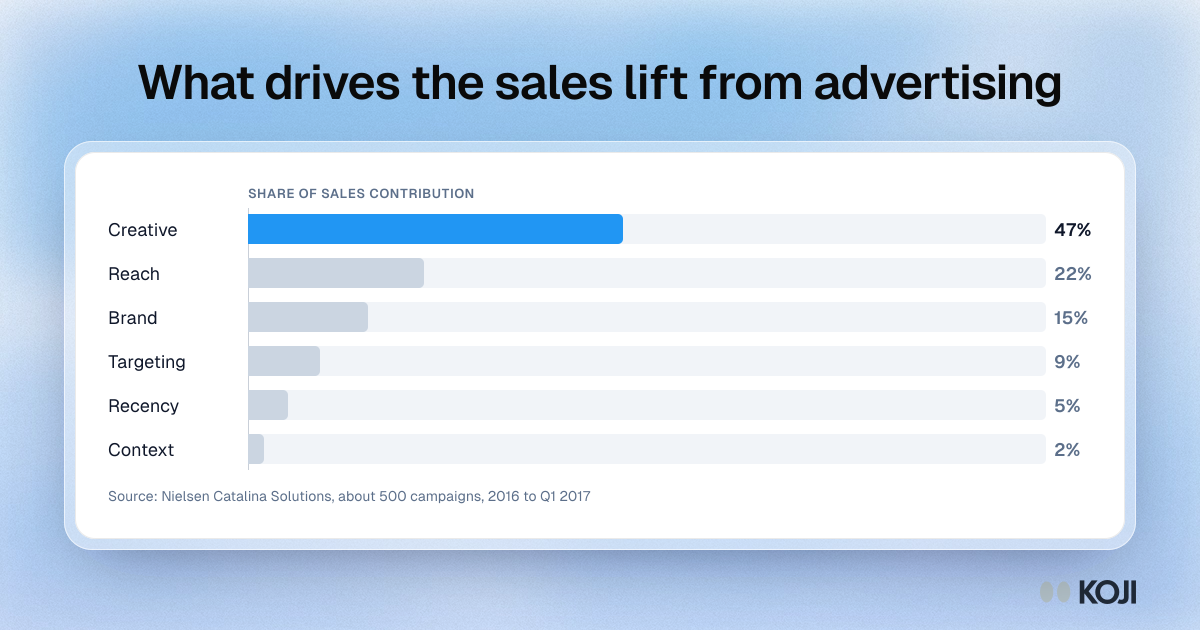
What drives the sales lift from advertising
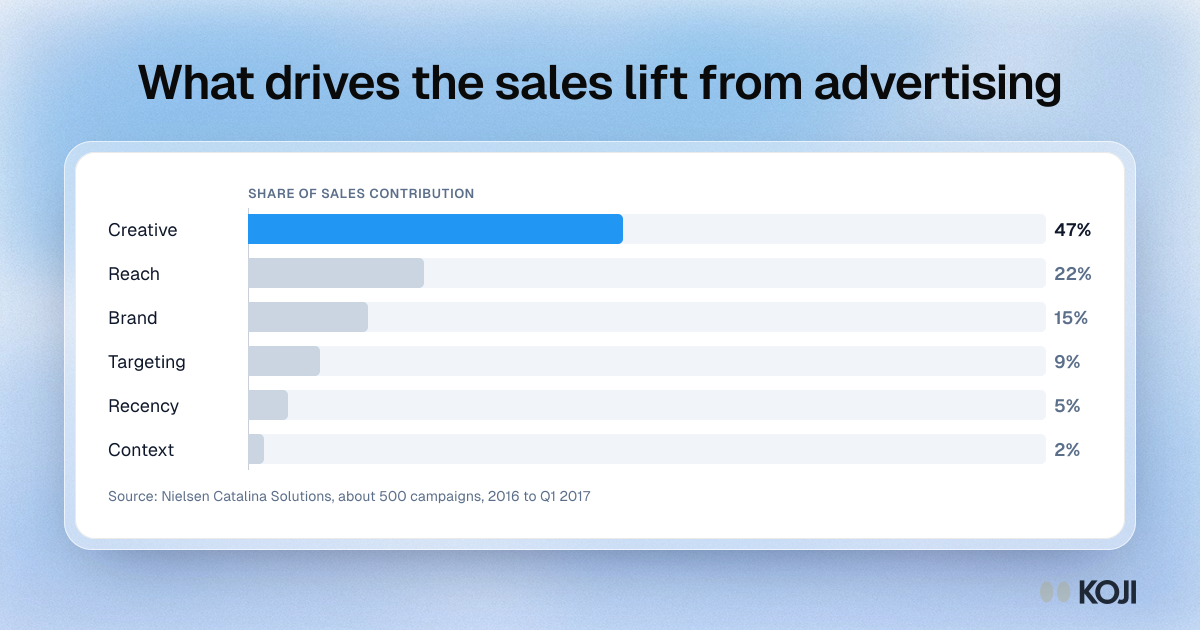
Nielsen Catalina Solutions split the sales contribution of about 500 ad campaigns from 2016 to early 2017 across six factors. The creative accounted for 47%, followed by reach, brand, targeting, recency and context. It is the case for testing creative before spending on media. Koji lets teams pre-test ad creative with timed image views and follow-up questions.
Where this appears
What's in this bar chart
| Share of sales contribution | |
|---|---|
| Creative | 47% |
| Reach | 22% |
| Brand | 15% |
| Targeting | 9% |
| Recency | 5% |
| Context | 2% |
Use this image
Free to use in your docs, decks and posts under CC BY 4.0, as long as you credit Koji with a link to this page. To embed it, paste this into your page:
html
<a href="https://www.koji.so/visuals/ad-sales-contribution-by-factor-nielsen"><img src="https://www.koji.so/visuals/ad-sales-contribution-by-factor-nielsen/ad-sales-contribution-by-factor-nielsen.png" alt="Bar chart of ad sales contribution by factor across about 500 campaigns: creative 47%, reach 22%, brand 15%, targeting 9%, recency 5%, context 2%." width="1200" height="630" /></a>
<p>Source: <a href="https://www.koji.so/visuals/ad-sales-contribution-by-factor-nielsen">What drives the sales lift from advertising</a>, Koji</p>