Bar chart
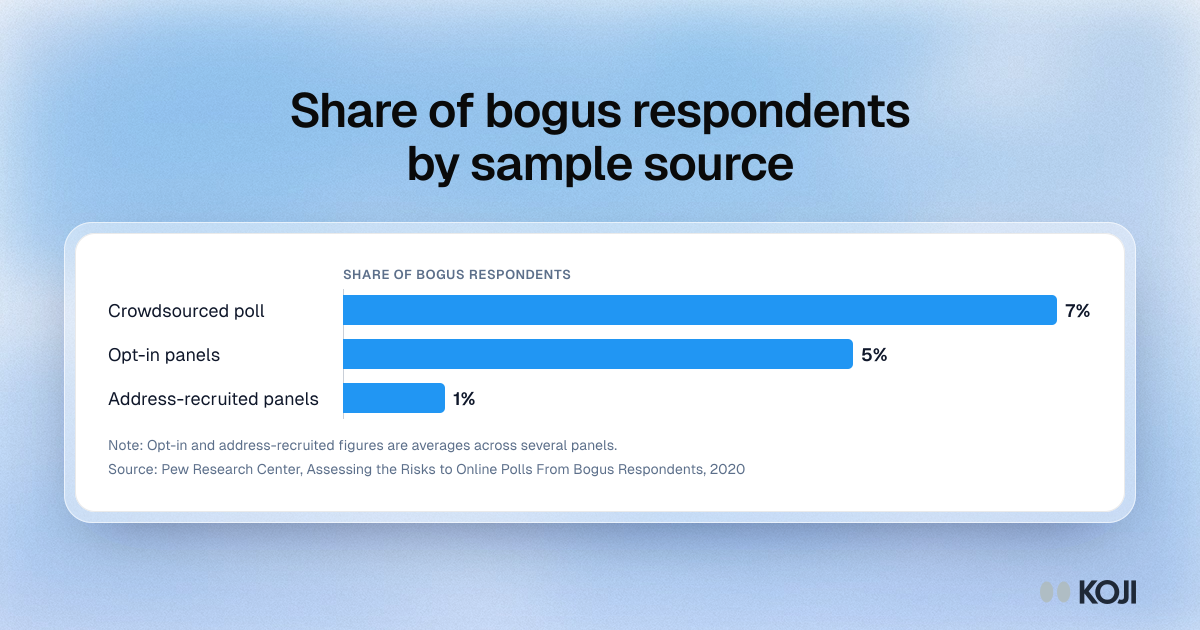
Share of bogus respondents by sample source
How often fake or careless answers got into online polls, by how people were recruited
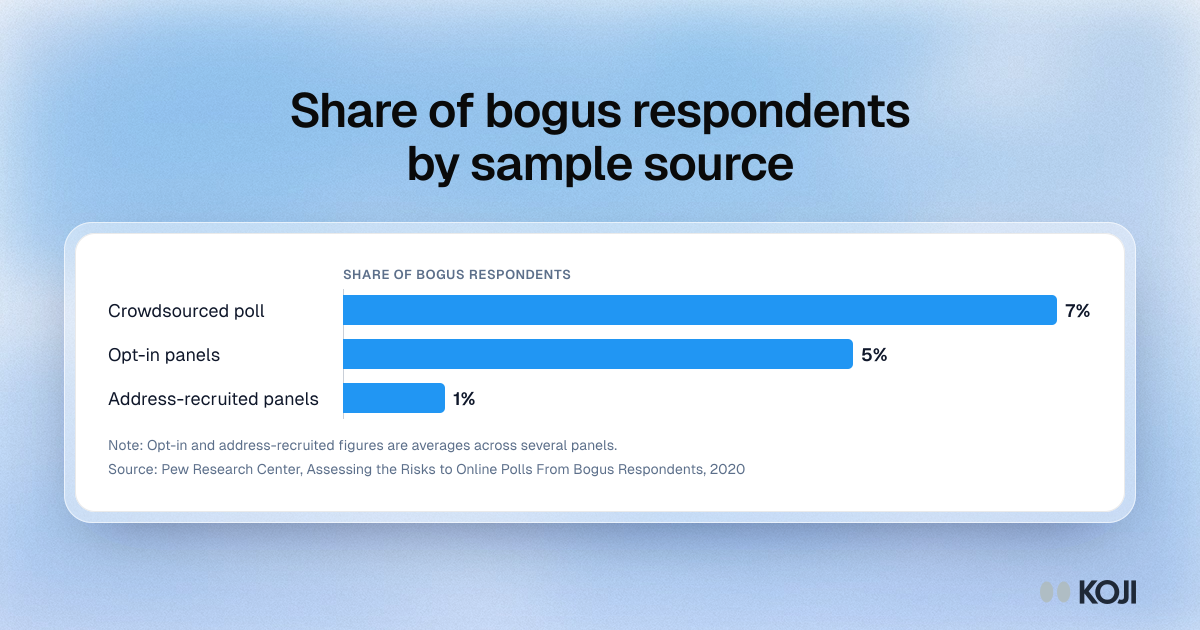
A bar chart from Pew Research Center's 2020 study of bogus respondents in online polls: 7% of a crowdsourced sample, 5% of opt-in panels on average and 1% of address-recruited panels. It is useful for founders and researchers deciding how much to trust people recruited from open online channels. Koji uses it in a playbook on screening customer interview recruits from Reddit and online communities.
Where this appears
What's in this bar chart
| Bogus respondents | |
|---|---|
| Crowdsourced poll | 7% |
| Opt-in panels | 5% |
| Address-recruited panels | 1% |
Opt-in and address-recruited figures are averages across several panels.
Use this image
Free to use in your docs, decks and posts under CC BY 4.0, as long as you credit Koji with a link to this page. To embed it, paste this into your page:
html
<a href="https://www.koji.so/visuals/bogus-respondents-by-sample-source-pew"><img src="https://www.koji.so/visuals/bogus-respondents-by-sample-source-pew/bogus-respondents-by-sample-source-pew.png" alt="Bar chart of bogus respondents by sample source in Pew's 2020 study: 7% in a crowdsourced poll, 5% in opt-in panels, 1% in address-recruited panels." width="1200" height="630" /></a>
<p>Source: <a href="https://www.koji.so/visuals/bogus-respondents-by-sample-source-pew">Share of bogus respondents by sample source</a>, Koji</p>