Reference table
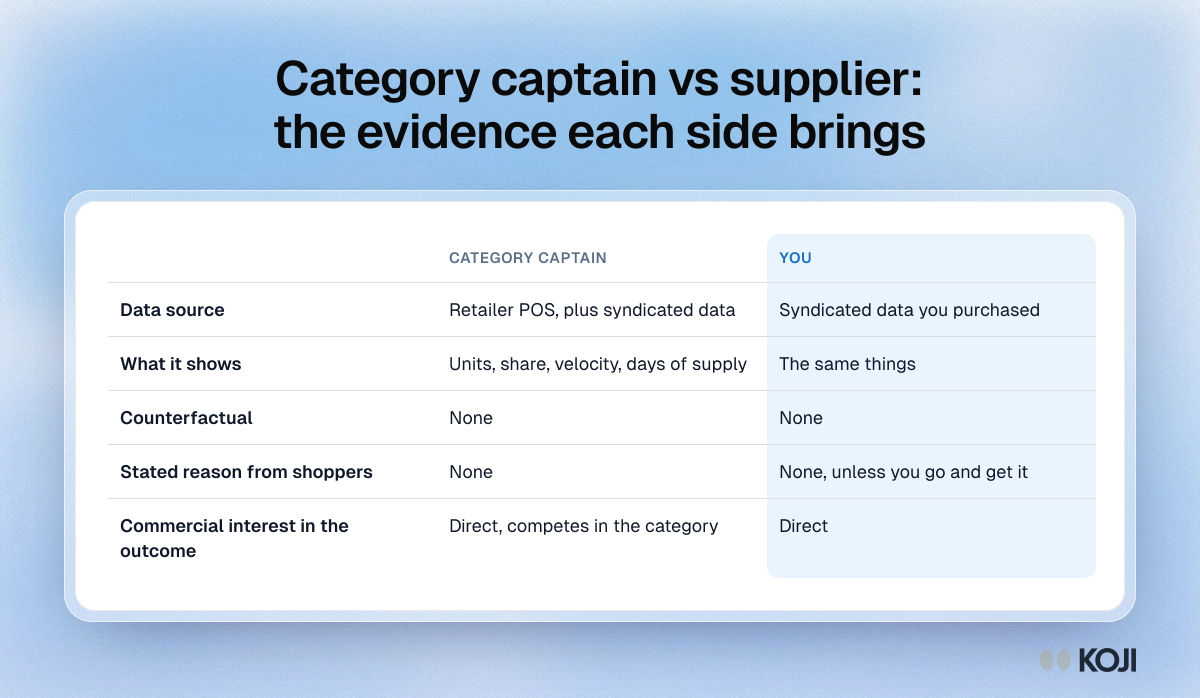
Category captain vs supplier: the evidence each side brings
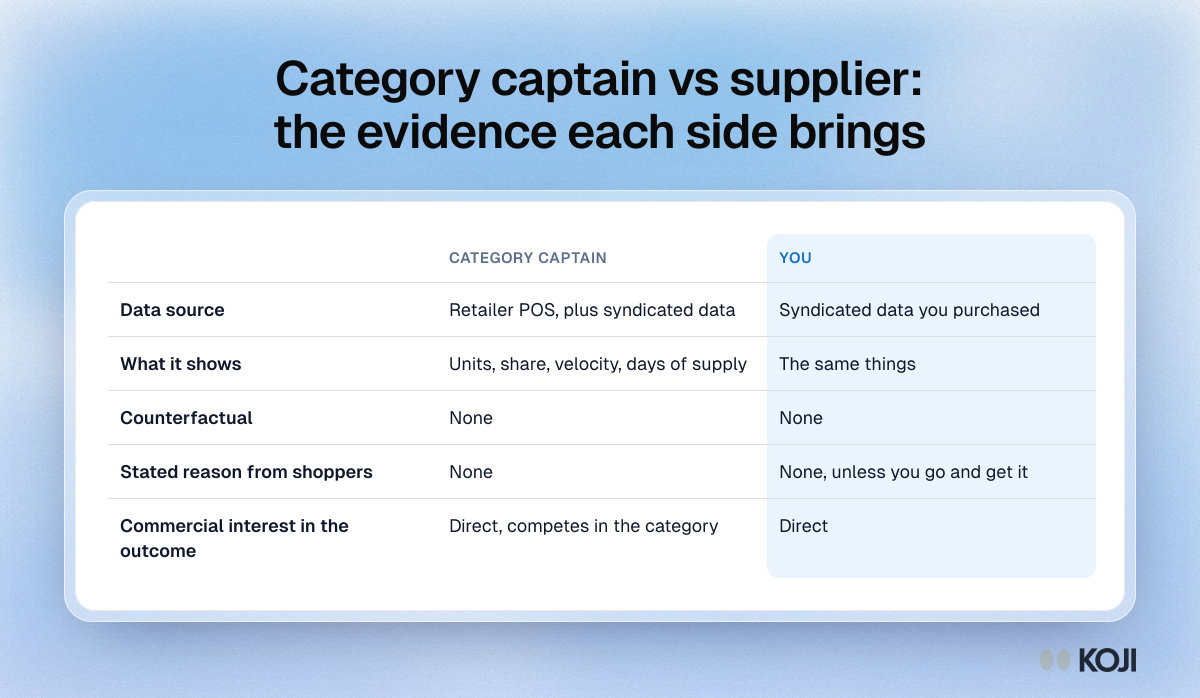
A side-by-side view of the evidence a category captain and a competing brand bring to a retailer range review. Both argue from point-of-sale and syndicated data, which shows units, share and velocity but has no counterfactual and no stated reason from shoppers. It is for brand, sales and category teams facing a delisting conversation. The way out is a different kind of evidence: shopper interviews, which Koji runs at the scale of a few hundred people in days.
Where this appears
What's in this reference table
| Category captain | You | |
|---|---|---|
| Data source | Retailer POS, plus syndicated data | Syndicated data you purchased |
| What it shows | Units, share, velocity, days of supply | The same things |
| Counterfactual | None | None |
| Stated reason from shoppers | None | None, unless you go and get it |
| Commercial interest in the outcome | Direct, competes in the category | Direct |
Use this image
Free to use in your docs, decks and posts under CC BY 4.0, as long as you credit Koji with a link to this page. To embed it, paste this into your page:
html
<a href="https://www.koji.so/visuals/category-captain-evidence-asymmetry-table"><img src="https://www.koji.so/visuals/category-captain-evidence-asymmetry-table/category-captain-evidence-asymmetry-table.png" alt="Table comparing the evidence a category captain and a rival supplier bring to a range review: data source, what it shows, counterfactual and shopper reasons." width="1200" height="698" /></a>
<p>Source: <a href="https://www.koji.so/visuals/category-captain-evidence-asymmetry-table">Category captain vs supplier: the evidence each side brings</a>, Koji</p>