Bar chart
What shoppers do when an item is out of stock
Worldwide out-of-stock study, average out-of-stock rate 8.3%
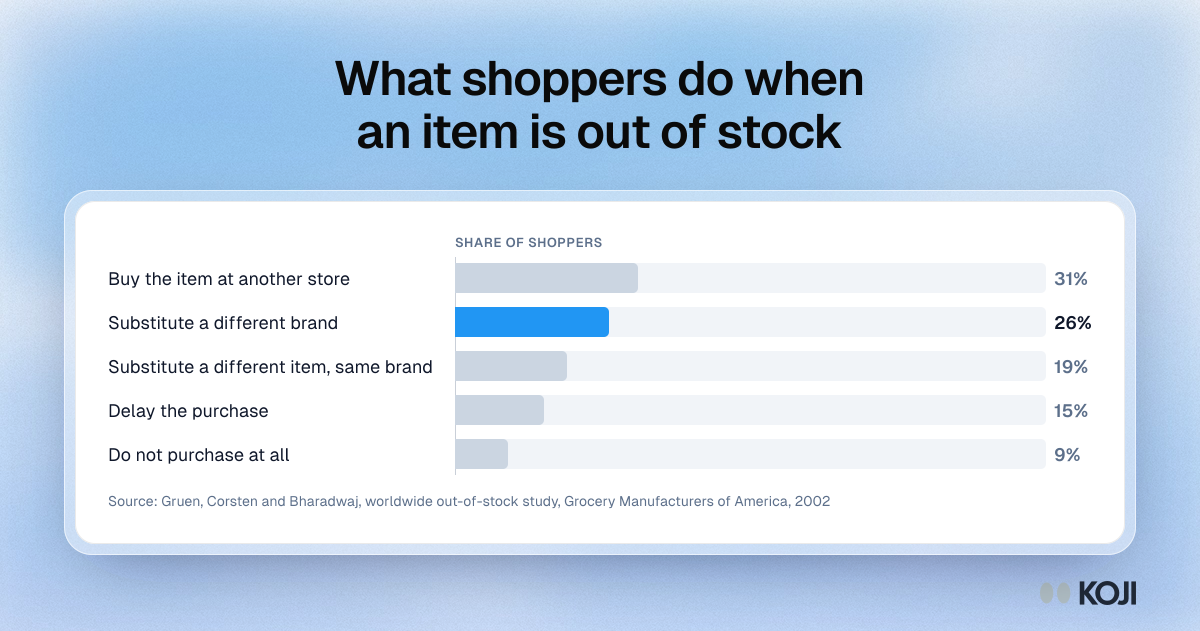
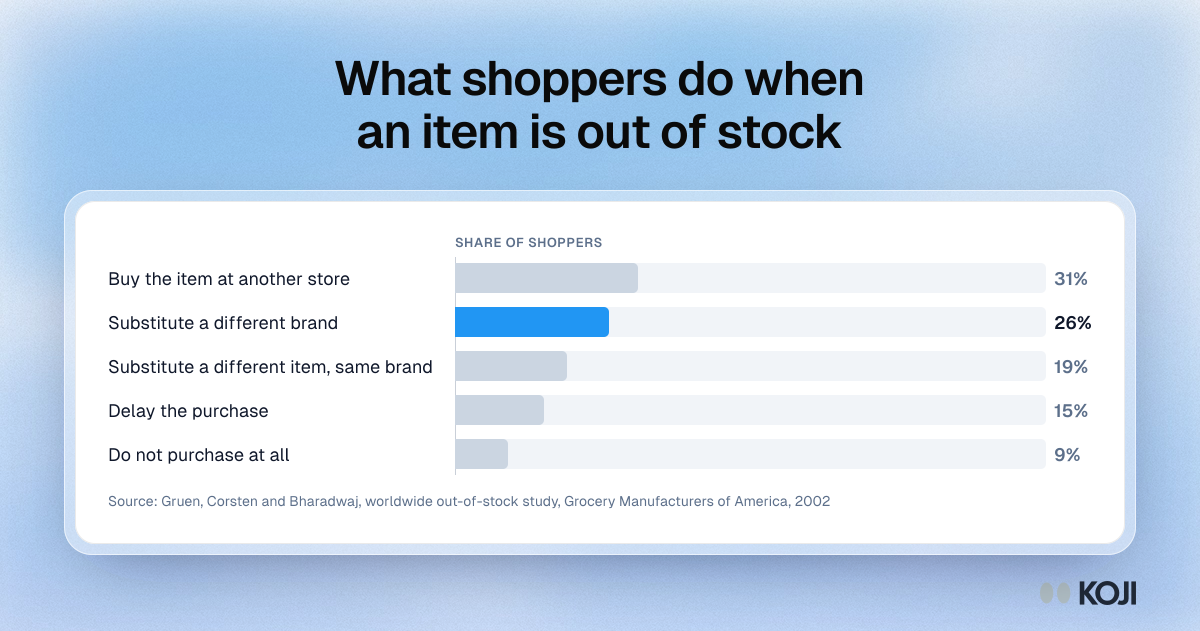
How shoppers responded when the grocery item they wanted was unavailable, from the worldwide out-of-stock study by Gruen, Corsten and Bharadwaj. Nearly a third bought it at another store and about a quarter switched to a different brand. For brand and category teams preparing for a range review, it shows why slow rate of sale is not the same as low demand. Koji interviews a retailer's category shoppers to find out which of these happened to your product.
Where this appears
What's in this bar chart
| Share of shoppers | |
|---|---|
| Buy the item at another store | 31% |
| Substitute a different brand | 26% |
| Substitute a different item, same brand | 19% |
| Delay the purchase | 15% |
| Do not purchase at all | 9% |
Use this image
Free to use in your docs, decks and posts under CC BY 4.0, as long as you credit Koji with a link to this page. To embed it, paste this into your page:
<a href="https://www.koji.so/visuals/shopper-responses-to-out-of-stock-items"><img src="https://www.koji.so/visuals/shopper-responses-to-out-of-stock-items/shopper-responses-to-out-of-stock-items.png" alt="Bar chart of shopper responses to an out-of-stock item: 31% buy at another store, 26% switch brand, 19% switch item, 15% delay, 9% do not buy." width="1200" height="631" /></a>
<p>Source: <a href="https://www.koji.so/visuals/shopper-responses-to-out-of-stock-items">What shoppers do when an item is out of stock</a>, Koji</p>
Related
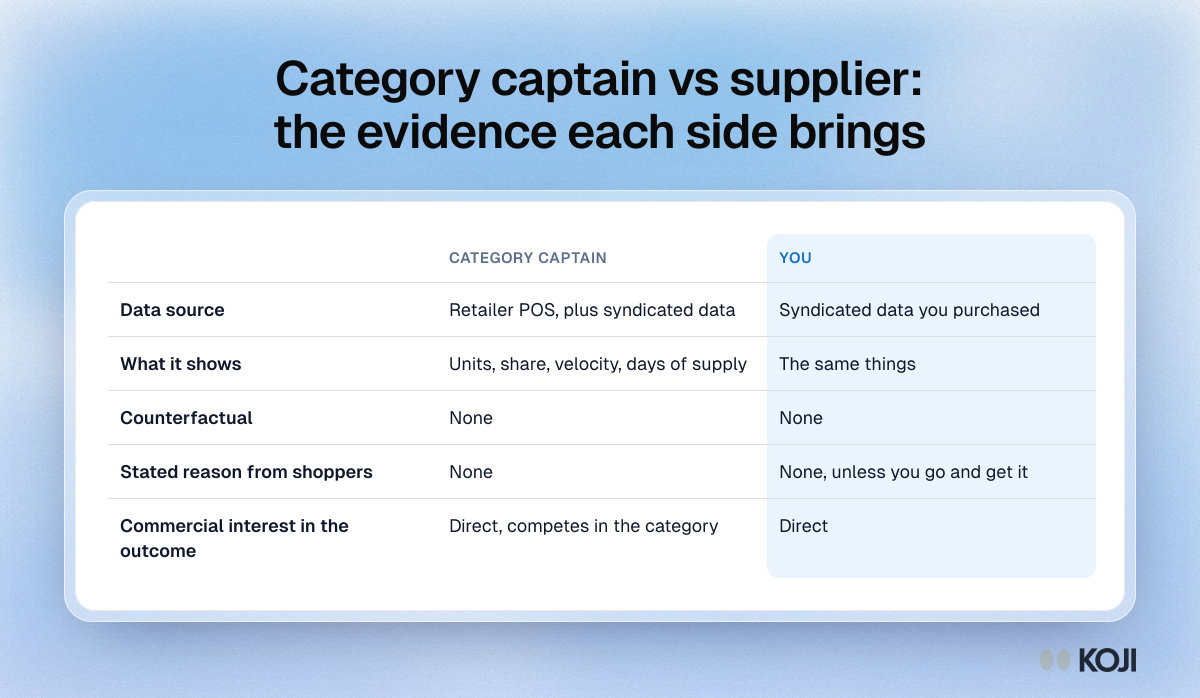
Category captain vs supplier: the evidence each side brings
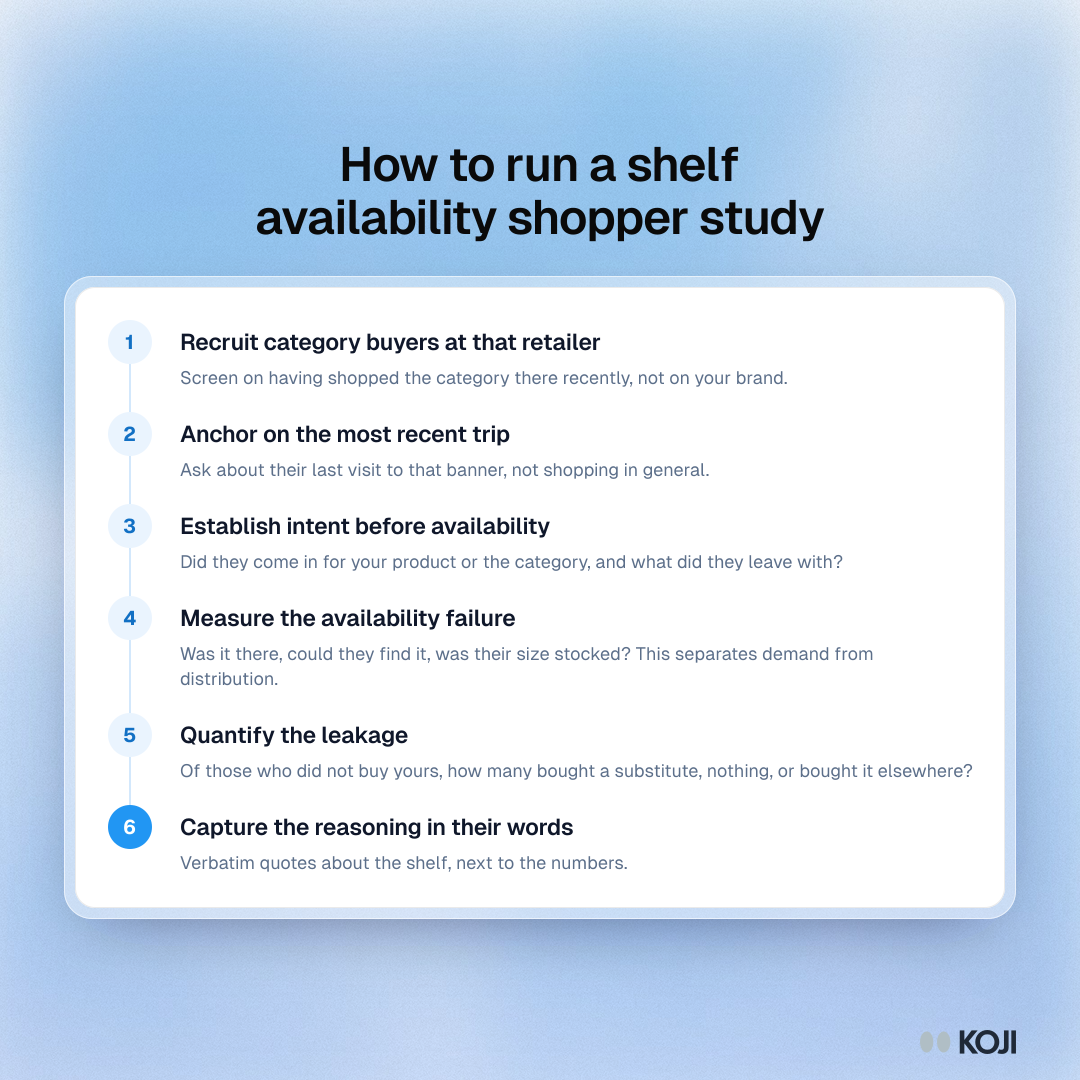
How to run a shelf availability shopper study
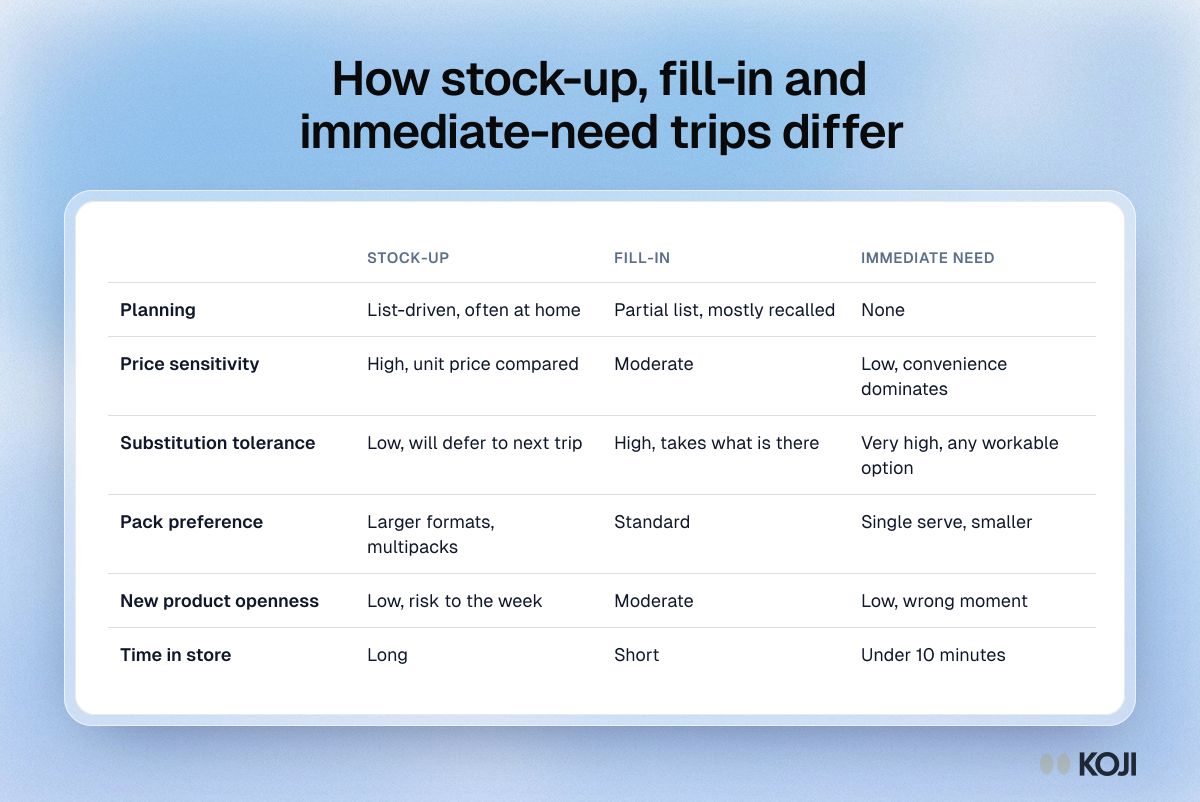
How stock-up, fill-in and immediate-need trips differ
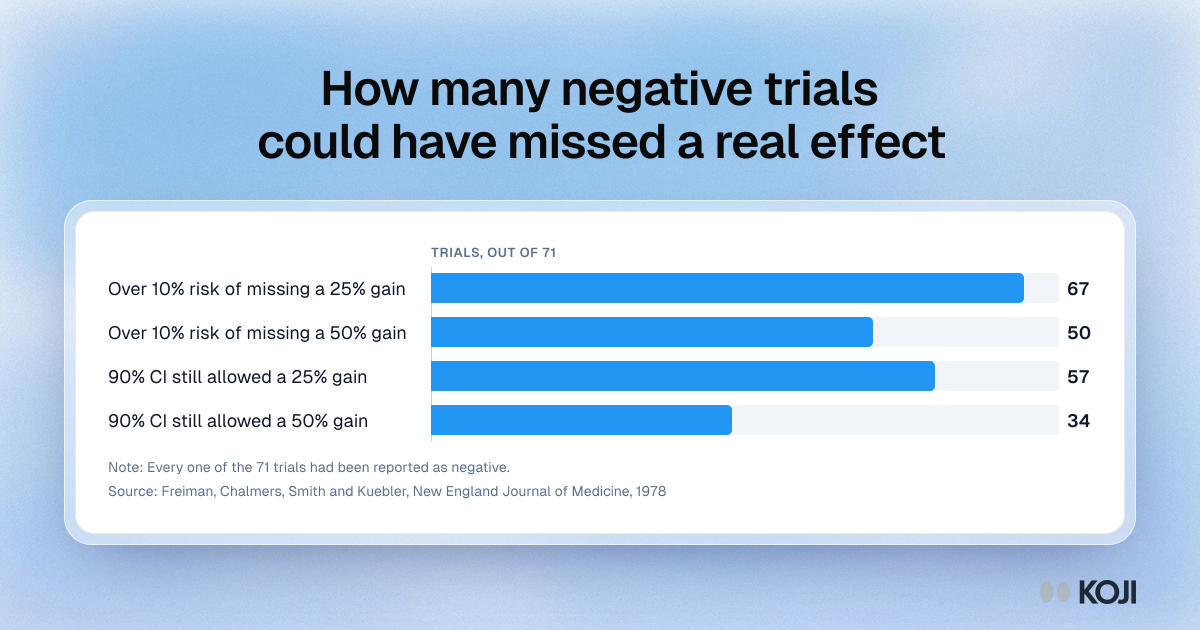
How many negative trials could have missed a real effect
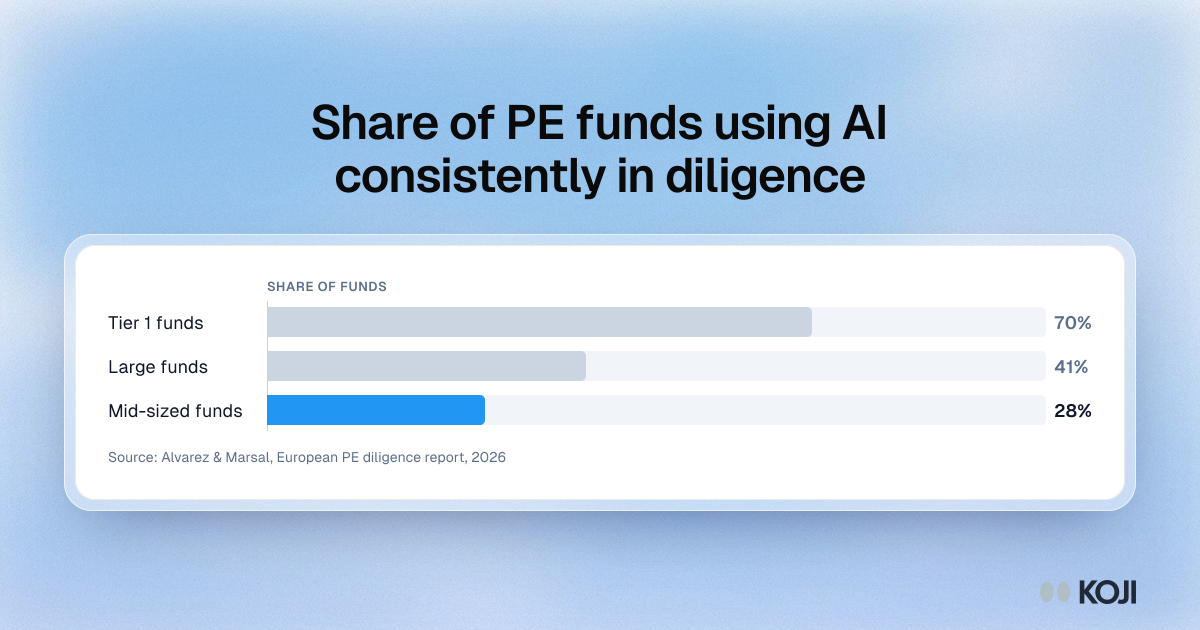
Share of PE funds using AI consistently in diligence
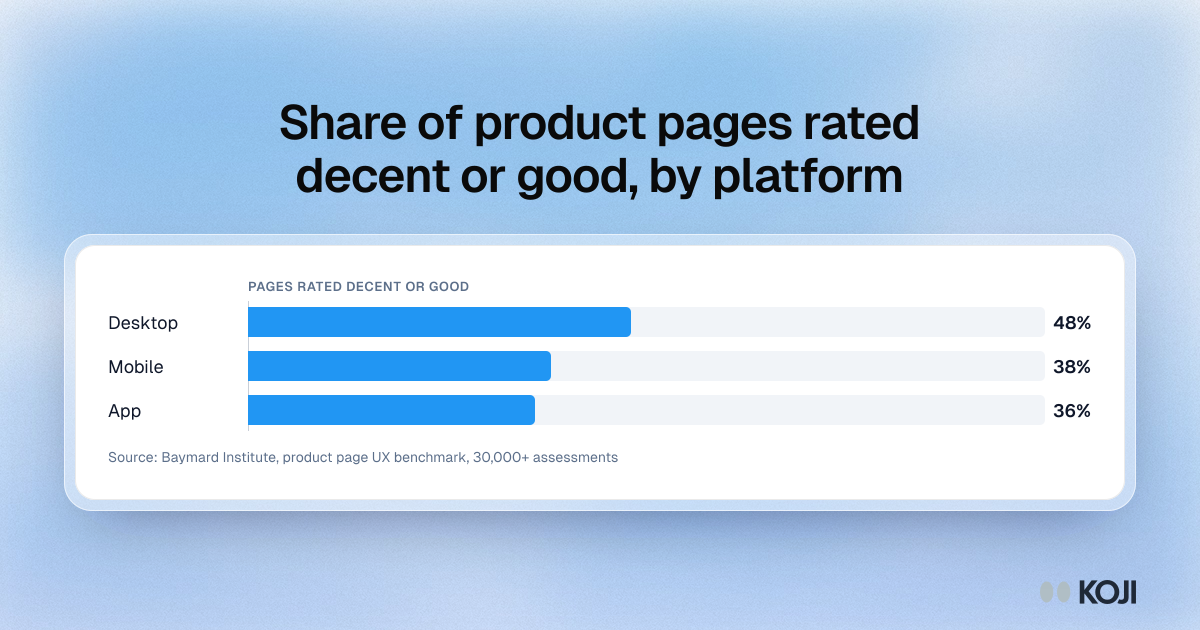
Share of product pages rated decent or good, by platform