Reference table
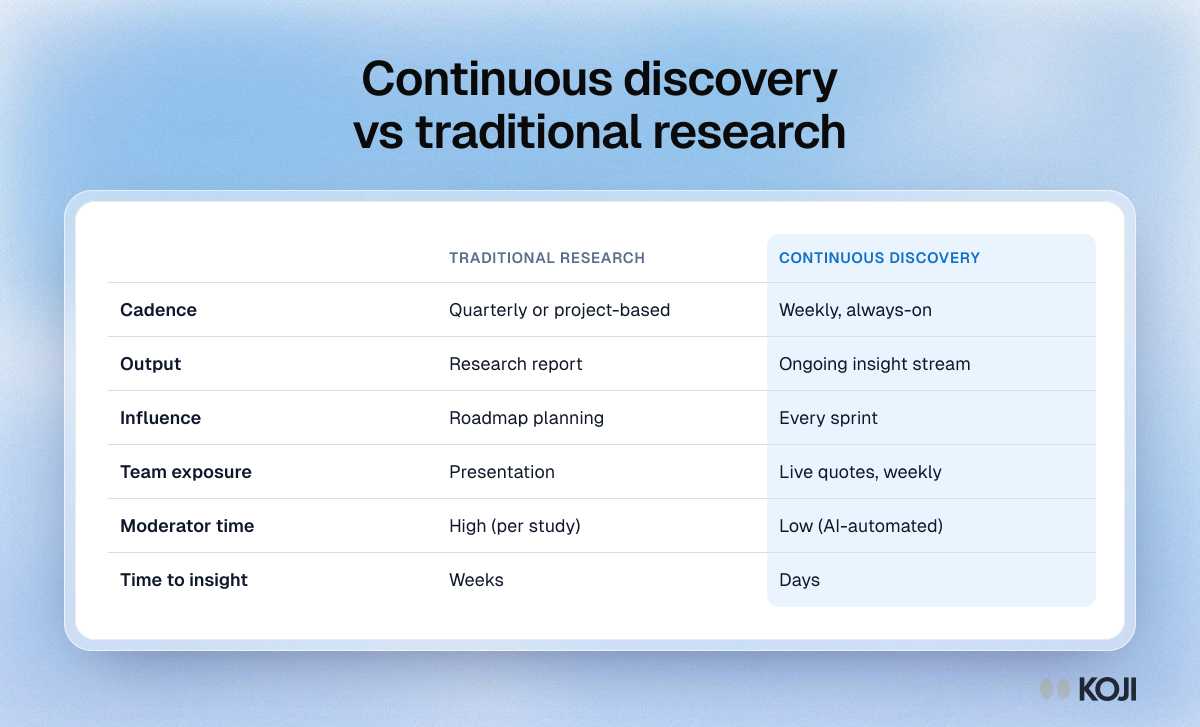
Continuous discovery vs traditional research
Cadence, output, influence and time to insight side by side
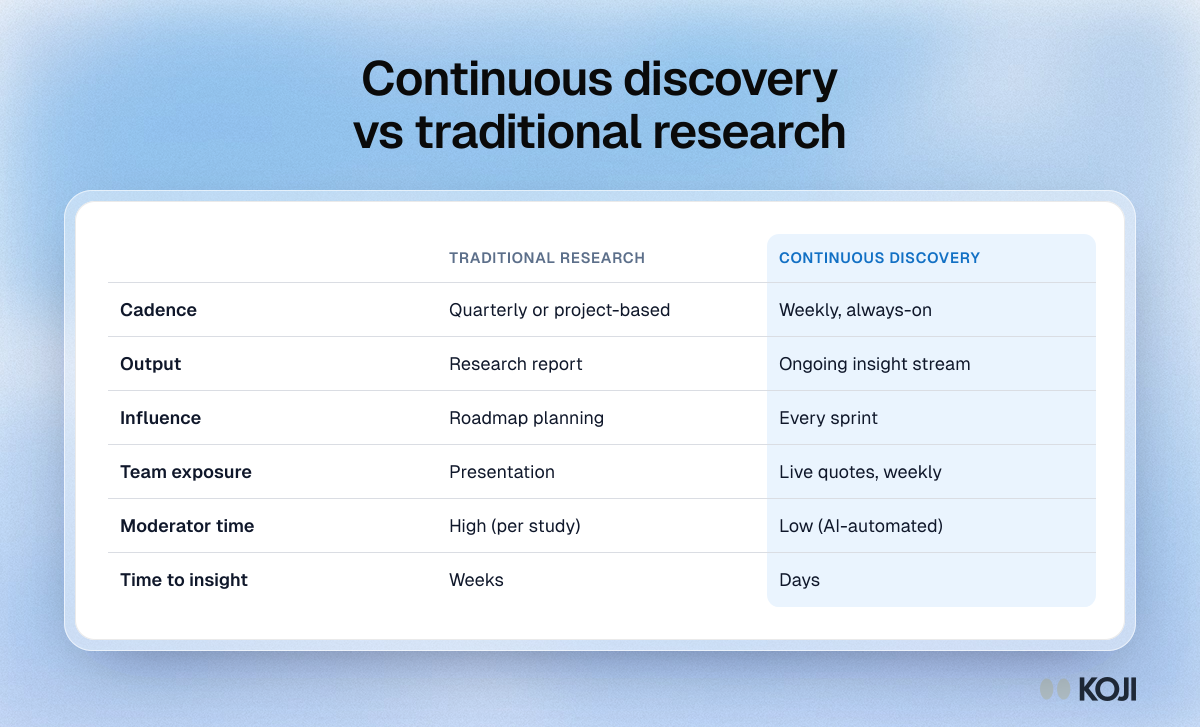
A comparison of project-based research and continuous discovery across six dimensions: how often it runs, what it produces, which decisions it reaches, how the team hears from customers, how much moderator time it takes and how fast insight arrives. Use it to make the case for a weekly habit to your team. AI-moderated interviews in Koji are what bring moderator time down for the continuous column.
Where this appears
What's in this reference table
| Traditional research | Continuous discovery | |
|---|---|---|
| Cadence | Quarterly or project-based | Weekly, always-on |
| Output | Research report | Ongoing insight stream |
| Influence | Roadmap planning | Every sprint |
| Team exposure | Presentation | Live quotes, weekly |
| Moderator time | High (per study) | Low (AI-automated) |
| Time to insight | Weeks | Days |
Use this image
Free to use in your docs, decks and posts under CC BY 4.0, as long as you credit Koji with a link to this page. To embed it, paste this into your page:
html
<a href="https://www.koji.so/visuals/continuous-discovery-vs-traditional-research-table"><img src="https://www.koji.so/visuals/continuous-discovery-vs-traditional-research-table/continuous-discovery-vs-traditional-research-table.png" alt="Table comparing traditional research and continuous discovery on cadence, output, influence, team exposure, moderator time and time to insight" width="1200" height="727" /></a>
<p>Source: <a href="https://www.koji.so/visuals/continuous-discovery-vs-traditional-research-table">Continuous discovery vs traditional research</a>, Koji</p>