Scatter plot
Map of customer insights platforms
Where ten platforms sit between behaviour and voice, and between scores and reasons.
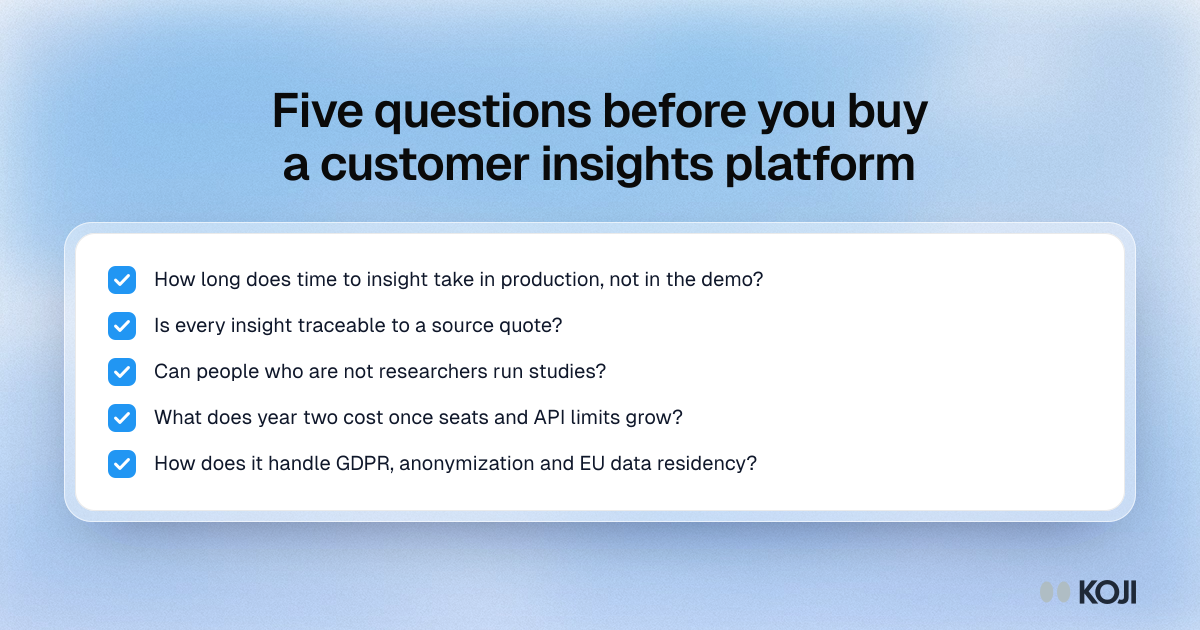
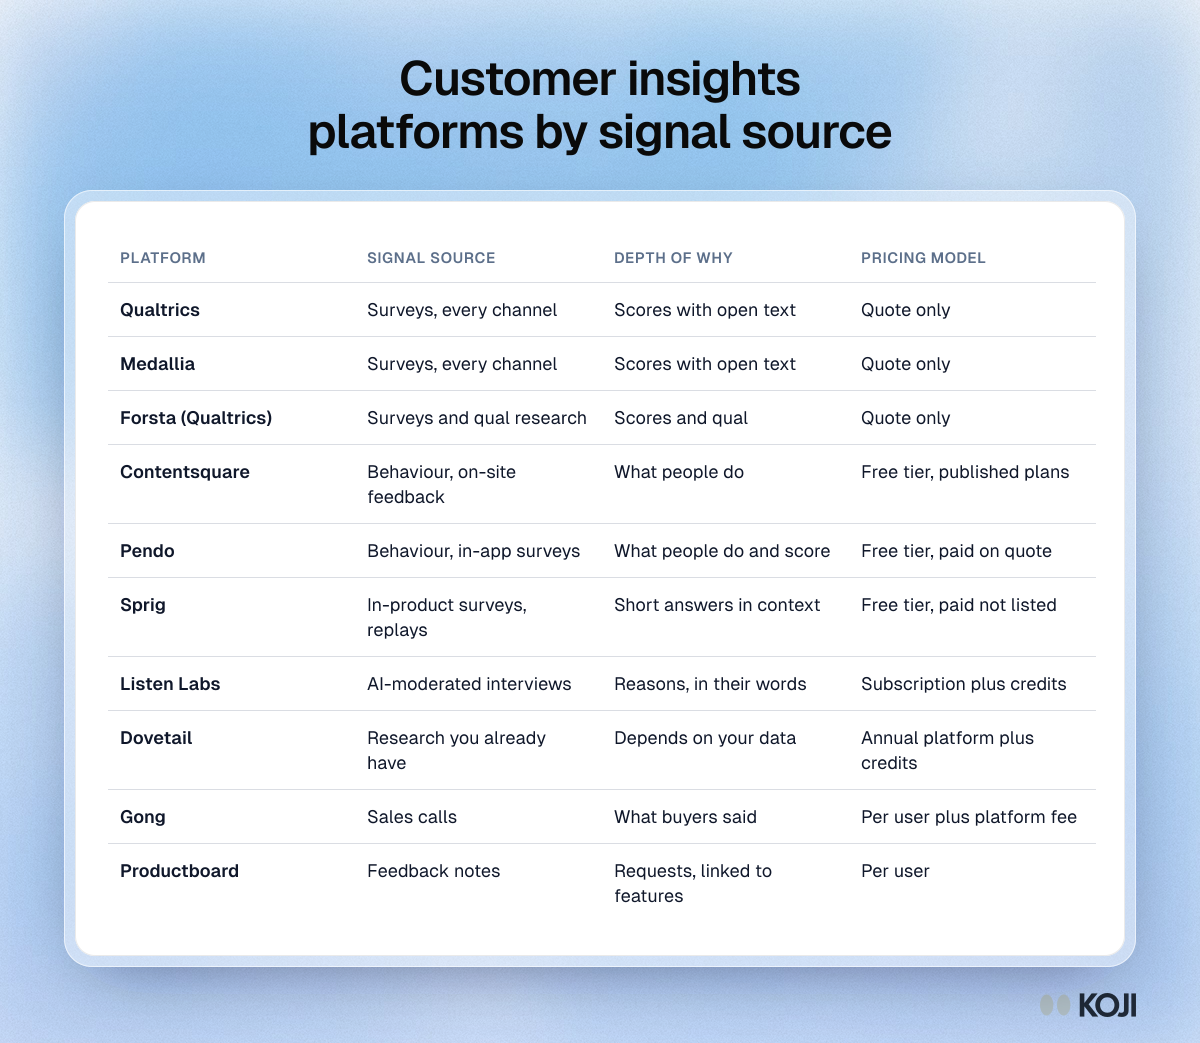
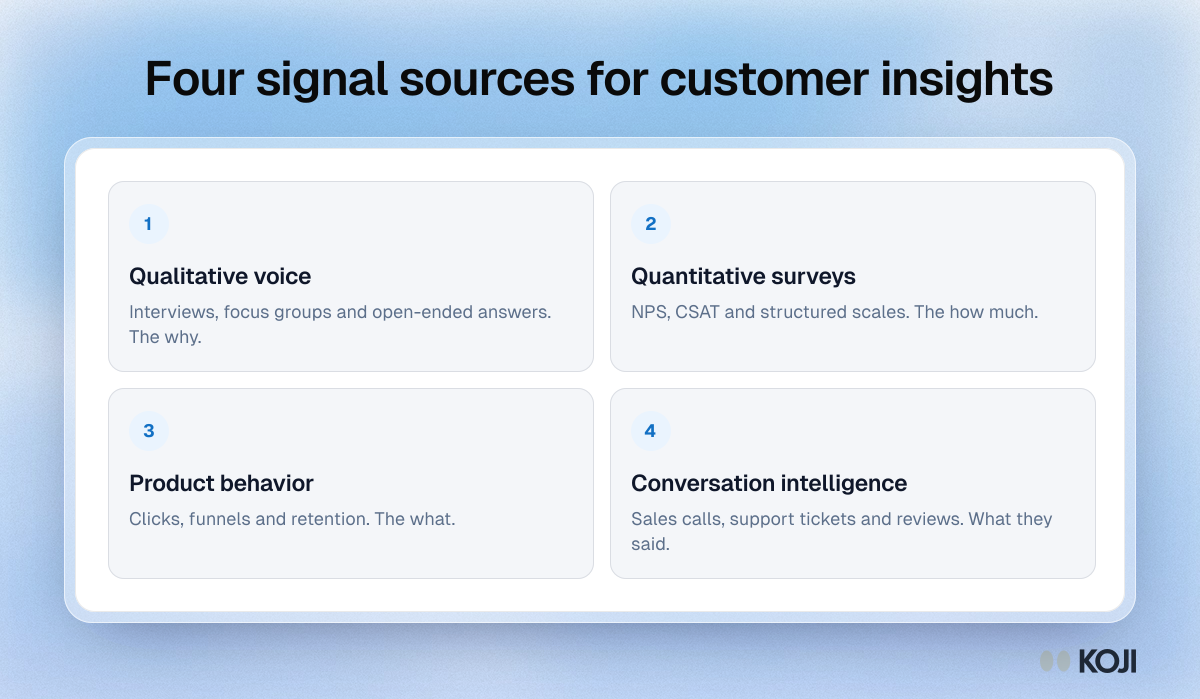
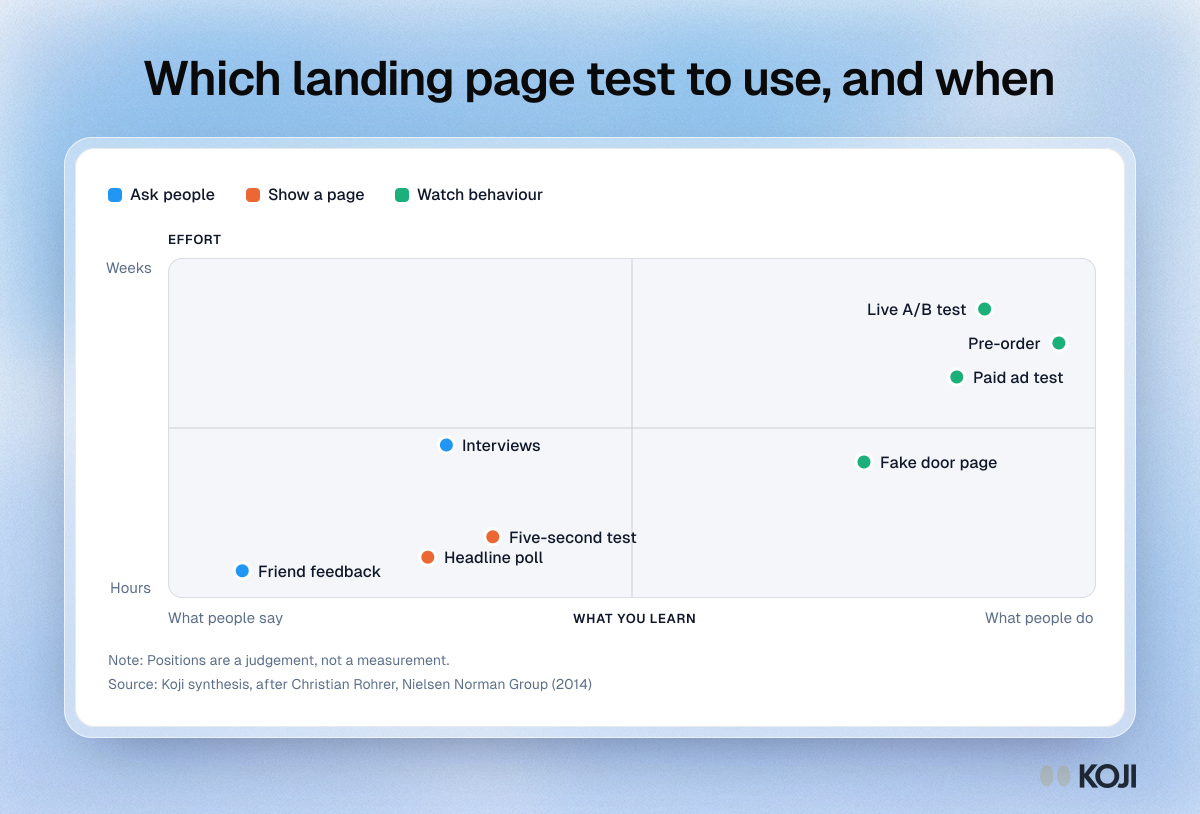
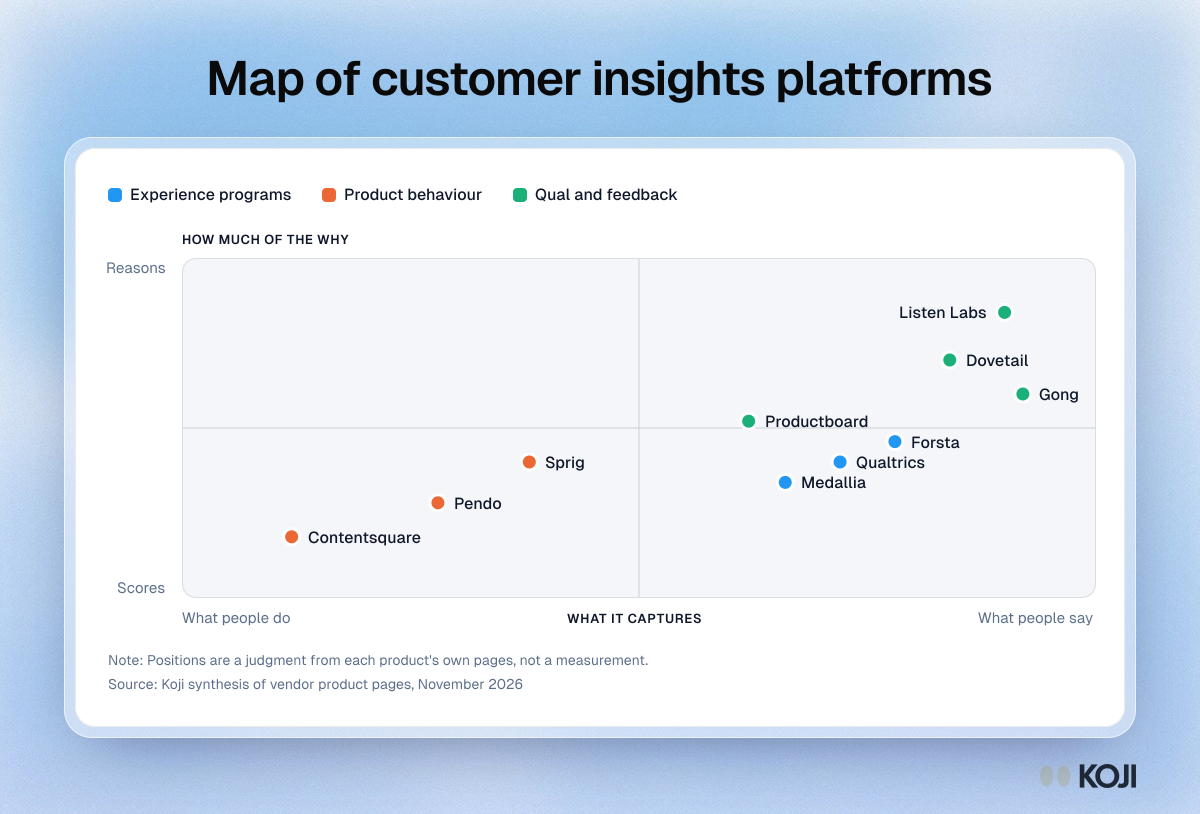
A method map that places ten customer insights platforms on two dimensions: whether they capture what people do or what people say, and whether they return scores or reasons. Experience programs such as Qualtrics and Medallia sit in the middle, behaviour tools such as Contentsquare and Pendo to the lower left, and interview and research tools to the upper right. Use it to see which kind of platform fills your gap. It is a judgment from product pages, not a measurement.
Where this appears
What's in this scatter plot
| What it captures | How much of the why | Kind | |
|---|---|---|---|
| Qualtrics | 72 | 40 | Experience programs |
| Medallia | 66 | 34 | Experience programs |
| Forsta | 78 | 46 | Experience programs |
| Contentsquare | 12 | 18 | Product behaviour |
| Pendo | 28 | 28 | Product behaviour |
| Sprig | 38 | 40 | Product behaviour |
| Listen Labs | 90 | 84 | Qual and feedback |
| Dovetail | 84 | 70 | Qual and feedback |
| Gong | 92 | 60 | Qual and feedback |
| Productboard | 62 | 52 | Qual and feedback |
Positions are a judgment from each product's own pages, not a measurement.
Use this image
Free to use in your docs, decks and posts under CC BY 4.0, as long as you credit Koji with a link to this page. To embed it, paste this into your page:
<a href="https://www.koji.so/visuals/customer-insights-platforms-method-map"><img src="https://www.koji.so/visuals/customer-insights-platforms-method-map/customer-insights-platforms-method-map.png" alt="Method map of ten customer insights platforms placed by whether they capture what people do or say and how much of the why they reveal" width="1200" height="814" /></a>
<p>Source: <a href="https://www.koji.so/visuals/customer-insights-platforms-method-map">Map of customer insights platforms</a>, Koji</p>