Bar chart
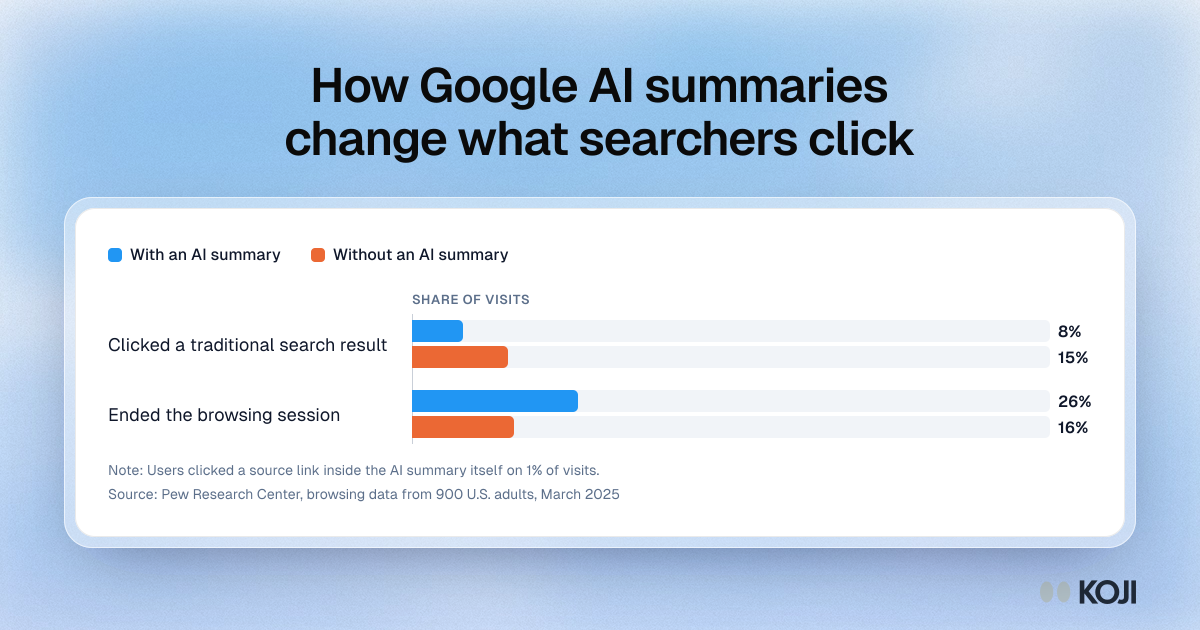
How Google AI summaries change what searchers click
Behaviour of 900 U.S. adults across 68,879 Google searches, measured rather than self-reported
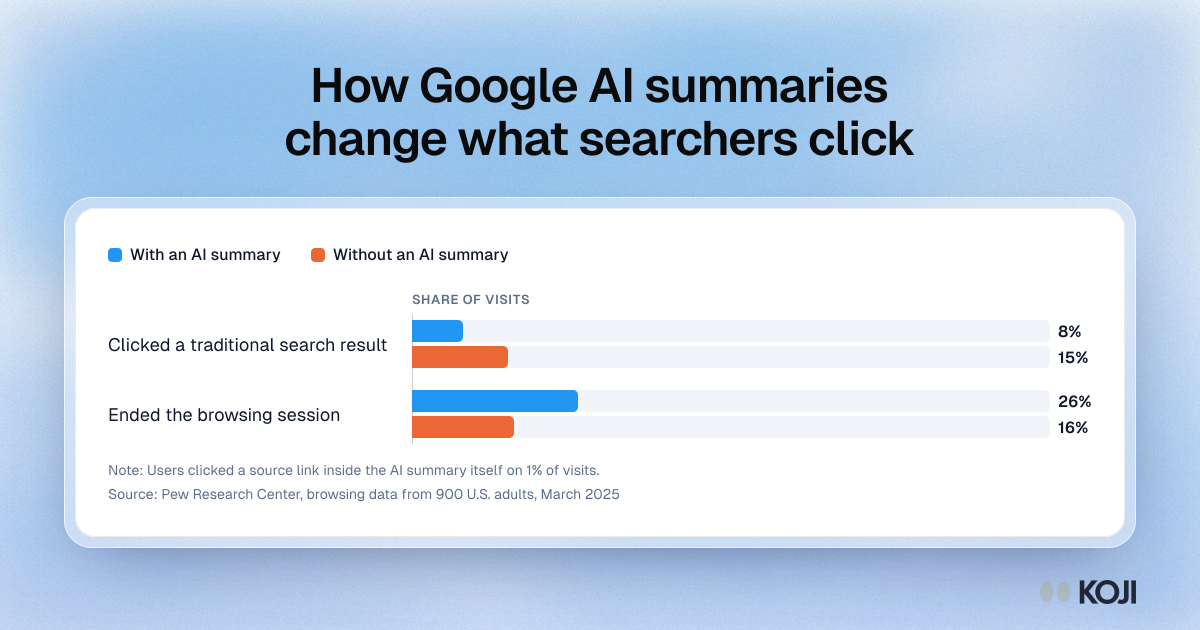
A grouped bar chart of Pew Research Center's browsing data on Google searches with and without an AI summary. With a summary, people clicked a traditional result on 8% of visits instead of 15%, ended their session more often, and clicked a source link inside the summary on just 1% of visits. Use it to explain why AI referral traffic undercounts AI influence. Koji interviews with real buyers can recover what they read and believed when no click was recorded.
Where this appears
What's in this bar chart
| With an AI summary | Without an AI summary | |
|---|---|---|
| Clicked a traditional search result | 8% | 15% |
| Ended the browsing session | 26% | 16% |
Users clicked a source link inside the AI summary itself on 1% of visits.
Use this image
Free to use in your docs, decks and posts under CC BY 4.0, as long as you credit Koji with a link to this page. To embed it, paste this into your page:
<a href="https://www.koji.so/visuals/google-ai-summary-click-rates-pew-2025"><img src="https://www.koji.so/visuals/google-ai-summary-click-rates-pew-2025/google-ai-summary-click-rates-pew-2025.png" alt="Bar chart: searchers clicked a traditional result on 8% of visits with an AI summary against 15% without, and ended the session on 26% against 16%." width="1200" height="630" /></a>
<p>Source: <a href="https://www.koji.so/visuals/google-ai-summary-click-rates-pew-2025">How Google AI summaries change what searchers click</a>, Koji</p>