Bar chart
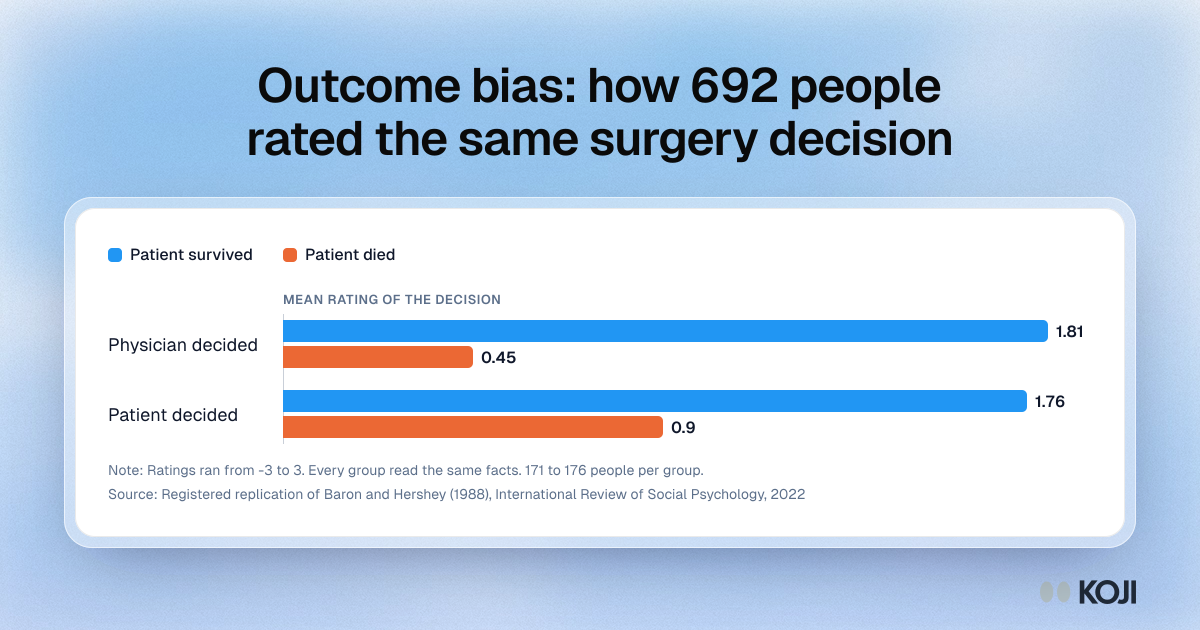
Outcome bias: how 692 people rated the same surgery decision
The decision was identical. Only the ending changed.
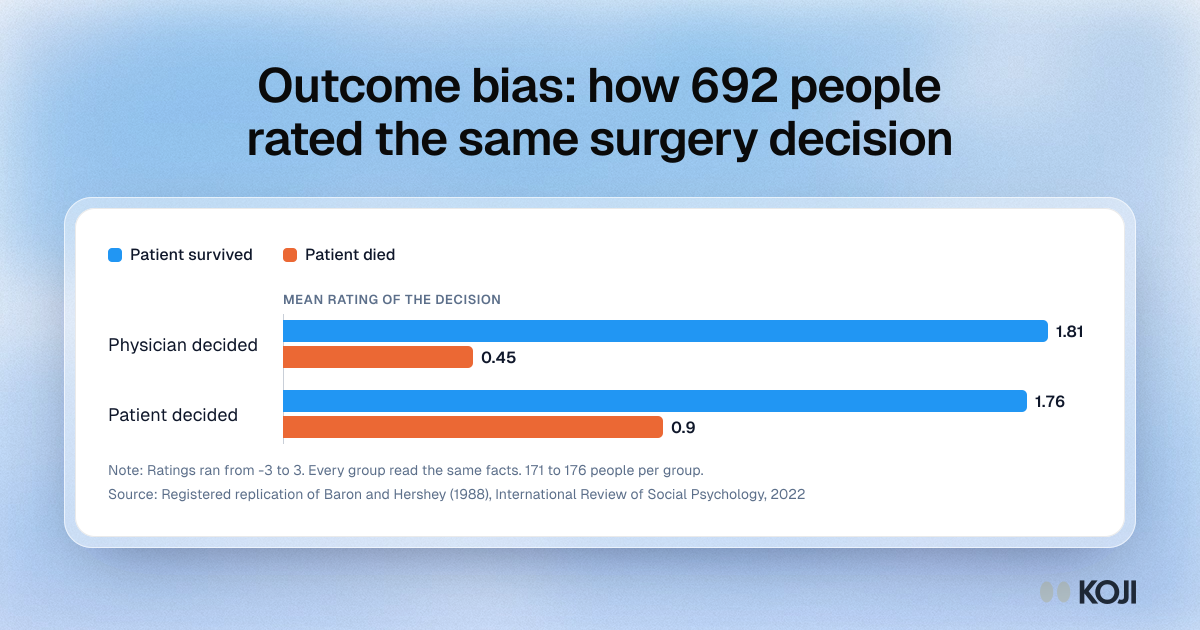
A bar chart from the 2022 registered replication of Baron and Hershey's outcome bias experiment. People rated a decision to have heart bypass surgery on a scale from -3 to 3, with the same information the decision maker had. When the patient survived, the decision got 1.81 or 1.76. When he died, it got 0.45 or 0.90. It shows why post-mortems that start with the result grade luck as much as judgement. Koji helps teams keep the evidence behind a decision attached to it.
Where this appears
What's in this bar chart
| Patient survived | Patient died | |
|---|---|---|
| Physician decided | 1.81 | 0.45 |
| Patient decided | 1.76 | 0.9 |
Ratings ran from -3 to 3. Every group read the same facts. 171 to 176 people per group.
Use this image
Free to use in your docs, decks and posts under CC BY 4.0, as long as you credit Koji with a link to this page. To embed it, paste this into your page:
<a href="https://www.koji.so/visuals/outcome-bias-surgery-decision-ratings-replication"><img src="https://www.koji.so/visuals/outcome-bias-surgery-decision-ratings-replication/outcome-bias-surgery-decision-ratings-replication.png" alt="Bar chart: a surgery decision rated 1.81 if the patient lived and 0.45 if he died when a physician decided, and 1.76 against 0.90 when the patient did." width="1200" height="630" /></a>
<p>Source: <a href="https://www.koji.so/visuals/outcome-bias-surgery-decision-ratings-replication">Outcome bias: how 692 people rated the same surgery decision</a>, Koji</p>