Key figure
How often personalized pricing showed up in testing
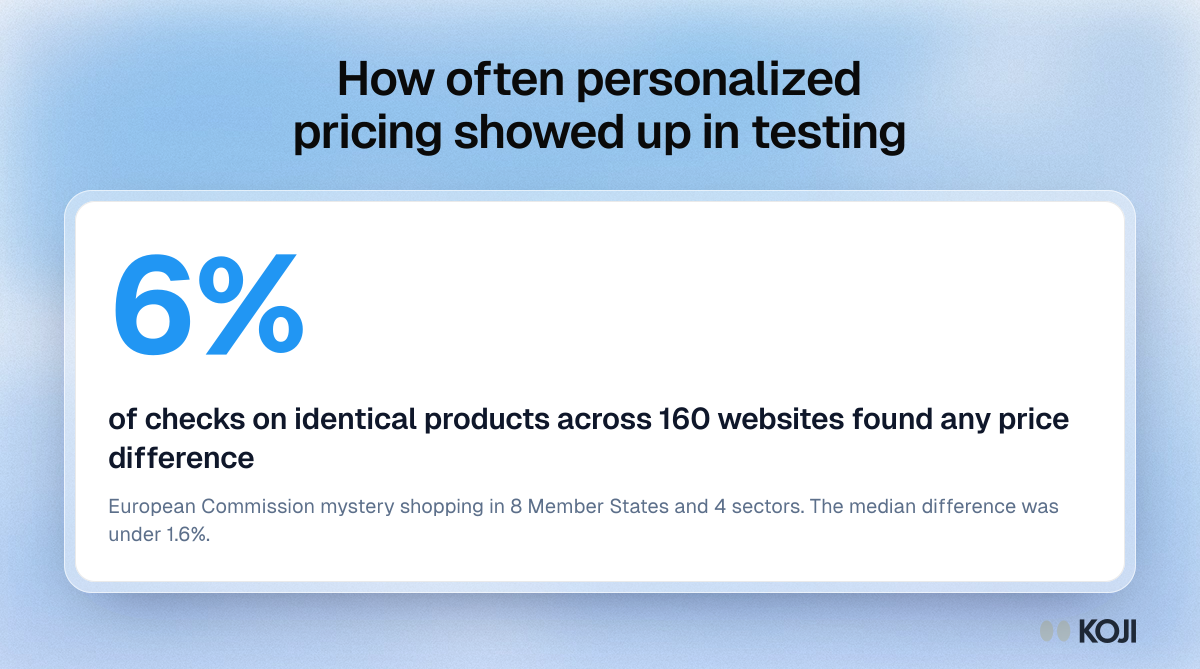
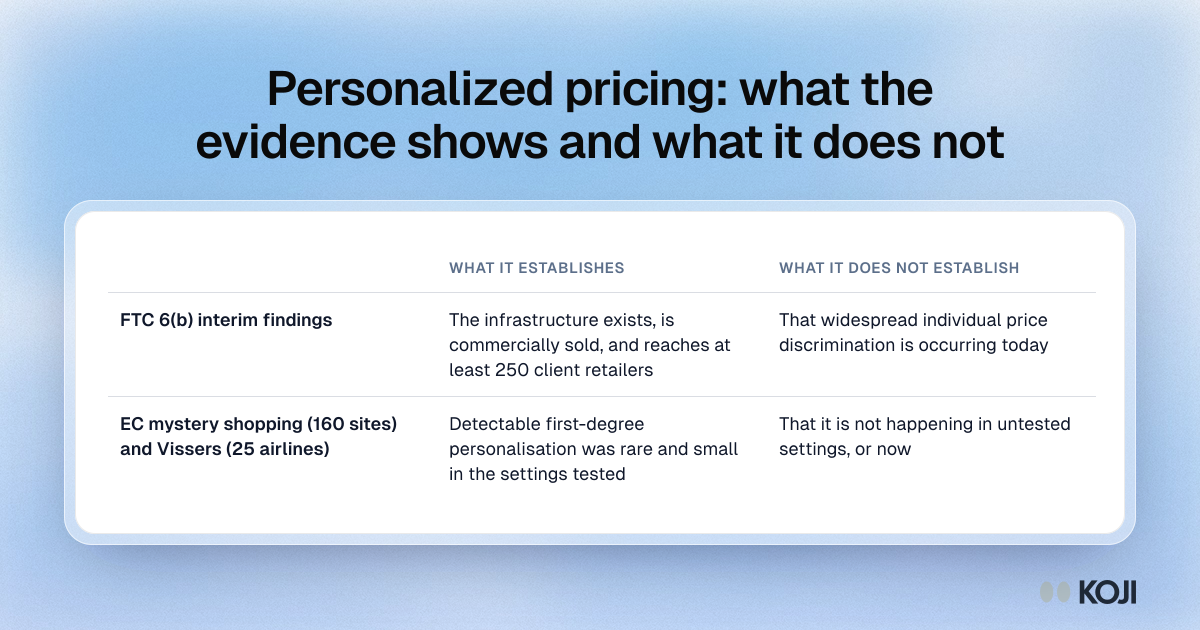
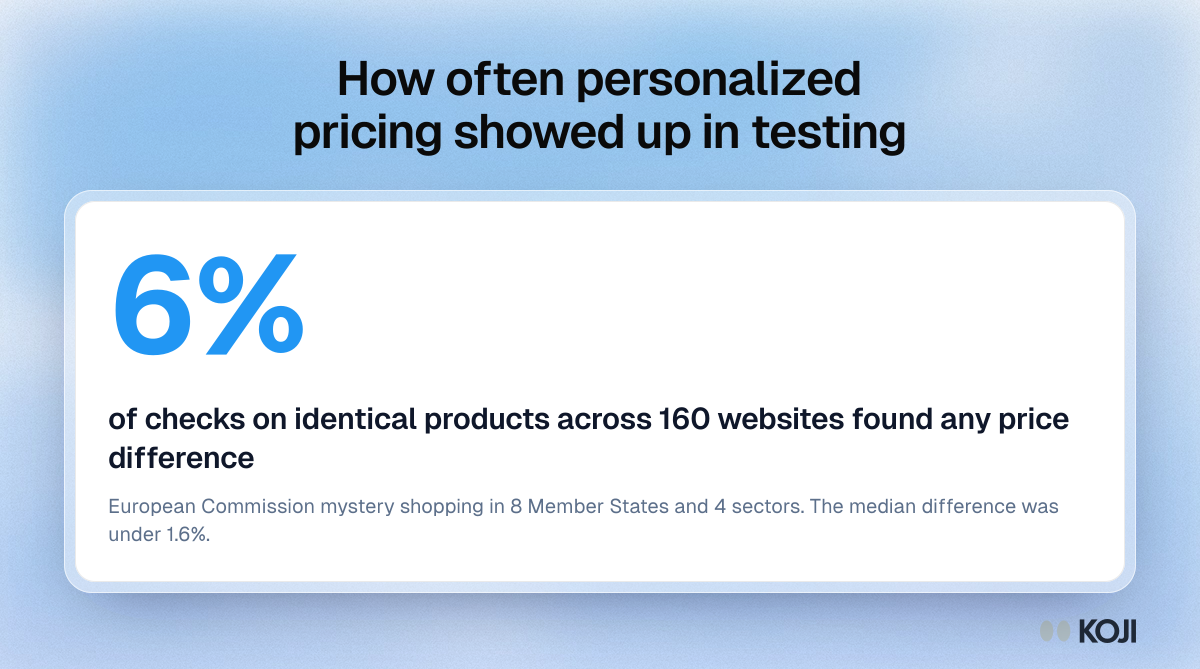
A study for the European Commission ran mystery shopping on 160 websites in 8 Member States and 4 sectors: televisions, sports shoes, hotel rooms and airline tickets. It found no personalised pricing. Price differences for identical products showed up in 6% of situations, with a median difference under 1.6%. The figure comes from the European Parliament study Personalised Pricing (PE 734.008, 2022).
Where this appears
What's in this key figure
6% of checks on identical products across 160 websites found any price differenceEuropean Commission mystery shopping in 8 Member States and 4 sectors. The median difference was under 1.6%.
Use this image
Free to use in your docs, decks and posts under CC BY 4.0, as long as you credit Koji with a link to this page. To embed it, paste this into your page:
<a href="https://www.koji.so/visuals/personalized-pricing-six-percent-price-differences"><img src="https://www.koji.so/visuals/personalized-pricing-six-percent-price-differences/personalized-pricing-six-percent-price-differences.png" alt="Stat card: price differences for identical products appeared in only 6% of checks across 160 websites, with a median gap under 1.6%." width="1200" height="669" /></a>
<p>Source: <a href="https://www.koji.so/visuals/personalized-pricing-six-percent-price-differences">How often personalized pricing showed up in testing</a>, Koji</p>